Download
1 / 15
150 likes | 300 Vues
A decomposition of the IceCube DAQ in a small number of incredibly information-dense slides IceCube DAQ Review 2010/11/17 Kael Hanson. The DAQ Design Hierarchy. IN Performance: yes Maintainability: yes, probably, once we finally get to maintenance mode

E N D
A decomposition of the IceCube DAQ in a small number of incredibly information-dense slides IceCube DAQ Review 2010/11/17 Kael Hanson The DAQ Design Hierarchy
IN • Performance: yes • Maintainability: yes, probably, once we finally get to maintenance mode • Testability: wanted a system that was testable without using SPS. IMO we’ve fallen a bit short of this goal. • Developability (OK that’s not a real word): wanted a fast turnaround on the edit/compile/package/deploy/test cycle – especially in late 2006 / early 2007 when we were under the gun to get something delivered. We can typically march through this whole process in 1-2 minutes. • Portability: there is SPS and SPTS but to achieve the last goal we wanted it possible to run the DAQ on UNIX / Mac laptops without much specialization. DAQ code itself runs just about anywhere – I’ve even brought parts up under WinXP. Python framework is less forgiving. • Minimal configuration input: yes, but we have some issues as we’ll discuss • NOT IN • Ease of use: we figured that world+dog is not interested on their laptops • Event analysis: it was decided that we would leave the data quality checks to verification and monitoring. I’m going to admit right now that we don’t have any framework to speak of designed to analyze our output data. DAQ Design Goals
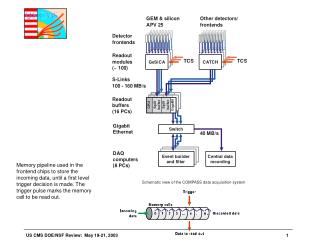
IceCube DAQ uses mostly tcp streams over gig-e to transfer data between components. the comm link between DOMs and hubs is the custom dor protocol – 1 mbit/s master/slave . Lines indicate Thin lines: Unidirectional data thick lines: bi-directional requester/sender architecture Not shown Python control framework DAQ component system Secondary streams produced by the string hub components Secondary builders Note: AMANDA system in shaded rectangle is deprecated and has not been used since end of IC40 data run May 2009 Top Level Data-Flow Diagram
The HUB-DOR messaging system is rolled up in the DOMApp class which currently implements most of the messages defined in the DOMAPP Messaging API. The Driver class handles interaction with the functionality exposed in the /proc fs • Initialization • Configuration • running • Take tcal 1 1Hz • read hit data • read moni data • read SN data • Sleep, MAYBE The stringHub is divided into two major functional sections: the front half which contains all of the code to talk to the DOMs and collect data from them . The Back half contains the sender – a major component that creates the trigger summaries from HLC tagged hits (but is run-time configurable to pass all hits, in fact), buffers hit data, and fulfills eventbuilder-generated readout requests. The MONI/TCAL/SN Output Engines simply forward hits to the secondary builders. Each StringHub contains code to effect a noise simulation which can be activated by run-time switches and configuration options … StringHub Internals
Sorting in IceCube DAQ follows a certain pattern: • you have N input streams which are themselves ordered following some methodology be it timestamps or be it event numbers. • you want to merge down into a single output stream. • you want to do it fast (O(N LOG(N)) in big-oh). • You don’t have any control of when the values arrive • Somewhat unexpectedly, seem to be the only people that want to do this operation in the history of information processing. So we had to develop our own algorithms. This is the core algorithm AS OF 2006: • construct in your mind 3 “nodes” and call them L, R, and SINK. L and R are peers and Sink is like a drainage pipe for them. each can hold a list of objects. You can push objects into L or R from the outside. When you push an object into a node it adds the object to its list and then asks its peer if it is empty. if the peer is empty it returns. if the peer is not empty the two peers decide who has the lesser object and then they remove it from their internal lists and push that object into the sink which then recursively will execute the same push rule. if sink is peerless – it’s a terminal node – then it simply accumulates objects. • a simple example of the sort is given in the sequence of 5 cartoons at the left. • The 6th cartoon shows how You may construct arbitrarily large sorting trees by connecting sinks as peers of other sinks and so on and so forth. You get a 2N Input tree. If you want fewer inputs drop the ∞ symbol into an unconnected node. if you want to flush and terminate a sorting tree drop ∞ into each input. the symbols will percolate through the tree • Speed : 500,000 objects/sec ON NEHALEM ARCHITECTURES • THIS IS THE MAIN BOTTLENECK IN SENDING ALL HITS TO TRIGGERS. TRACK ENGINE GROUP CLAIMS SIMILAR ALGORITHM GIVES 10X SPEED. Stringhubs use RAW HNK1 tree – other components use tree inside splicer interface to preserve backwards compatibility with older DAQ sorting. Cascaded Binary Sorting Tree (aka HKN1)
The Secondary Builder doesn’t really do that much – IT IS essentially three splicers wrapped in a DAQ component to merge the so-called secondary streams being emitted by the string hubs. • This could be a good place to do certain things as it is the one point in DAQ where all of this data is globally visible in one place, all nicely time-ordered: • monitoring, if monitoring were ever ported to java. Recall that this is pretty much as close to live as you can get with latencies on the order of seconds. during the recent dropped hits investigations I suggested that we put the overflow monitoring here. • Supernova triggering, if supernova triggering were ever ported to java. again, there is no delay due to hand-off of data to downstream processes. Secondary Builders
Trigger algorithms operate by examining hit payloads (Channel, time) which come in ordered by virtue of splicer in front which sorts (pre-sorted) streams from the many stringhubs. Dave G has recently split the sorting and I/O thread from the trigger execution thread. We (OK Dave) could go further still by threading each trigger algorithm as they are in principle non-interacting. For now the trigger thread steps in sequence over each trigger defined in the trigger configuration. • The IceCube DAQ trigger is a multi-level system with the in-ice and IceTop forming the frontline against the hubs and the global trigger sitting above them, merging overlapping triggers and sending trigger requests to the event builder. • To define a new trigger one needs to : • subclass abstract trigger • override the addParameter and runtrigger methods • Be sure to update the “earliest payload of interest” for the splicer (FWIW I think each trigger should just get its own copy of hit references and not worry about the common /splicer/ area – I guess this may be a hangover from the byte buffer cache days) • It actually turns out to be not that hard to make a trigger if you are java-literate and this summer past we had proof from t gluesenkamp who made the slowmonopole trigger having never touched DAQ code before. So I think with perhaps some docs it would be possible to open the trigger development to IceCube. • There are a few lingering problems in the trigger – namely : • Flasher after bursts kill trigger • Cluster triggers spontaneously die with odd NPE Triggers
Event builder is complex but principle of operation is straightforward: • Read global trigger requests: each request is numbered with a unique ID and contains a time window of interest to readout • extract individual requests (eb could be directed to readout just one hub or maybe just IceTop or maybe the entire detector, for example), create readout requests, and direct them to the appropriate hub • The sender component in the hubs reads the requests and returns a packet, possibly empty, containing all hits in this time window. The sender uses the time markers to delete buffer data which is determined no-longer relevant. • The event builder must assemble the readout data payloads returned into an event. they are collated by readout ID which serves as an event ID proxy. When that ID changes, an event is “tied off” and send out to the file dispatcher. • The file dispatcher just writes the data which is mostly contained in byte buffers to disk. With advent of V5 and later event formats the byte buffer dump goes through some processing to reduce the size of the event representation on disk. • The disk files, nominally on /mnt/data/pdaqlocalon the machine hosting the event builder, are chunked into 10 MB files. The event builder is now done with this data and it must be picked up by P&F. EventBuilder
DAQ Components abstracted by DAQComponent abstract class and all components must subclass this. it contains callback stubs for managing the life-cycle of components (see picture at left): starting, stopping, resetting (partial support), configuring and auto-discovery of components. additionally the super class provides much of the supporting monitoring framework to instrument common activities such as the input & output engines and splicers. more on this in monitoring. The system uses xml-RPC as RPC protocol. Most if not all of the glue is written in Python where XML-RPC is a “batteries-included” feature. on the Java side we use the apache XML-RPC 3.x engine. This diagram is now obsolete – in the HOBEES release of PDAQ we got rid of the intermediary DAQRun and now IceCube Live and CnCServer communicate directly (Dave whimsically described the old situation as driving a car by turning a steering wheel hooked to another steering wheel hooked to another steering wheel connected to the steering column …) The CnCServertypically sits on the experiment control machine but It is possible to run multiple instances of the DAQ in parallel and this is routinely done. Handy for making test runs / calibrations / flashers / &c. Component Architecture and the Control Framework
A generic monitoring bean output from Payload output engine operating in the trigger: • MBEAN MONITORING • DAQ components are instrumented with monitoring points so that external agents can peek inside to examine potentially interesting quantities such as stream flow rates or memory allocation statistics. • We are talking Java components here; we use the JMX Management beans fully supported from Java 1.6. These are run-time discoverable via some Java introspection mechanism: pretty easy to add new monitor points. As mentioned, the DAQComponent class possesses some boilerplate code to monitor automatically. Most components additionally extend this to provide component-specific monitoring. • The Beans are queried ultimately by a python daemon and so Dave had to write a thin RMI->XML-RPC bridge to effect this crossover. • This is a synchronous process: every 100 sec we get a snapshot of all beans • DAQ Logs • Use log4J framework to monitor asynchronous info/warn/error messages emitted by the components. • Somehow the console messages to System.out are trapped and re-directed to the log files too – handy as there is no console for remote components • ASCII-formatted logs and monitor messages sent to run directory under /mnt/data/pdaq/logs/runXXXXXX • Was essential during heavy development – still nice to have around but we probably do eat up 100 MB/day over scp just in log/moni traffic. There have been complaints … trigger: 2010-11-16 20:51:26: Depth: [0] RecordsSent: [6046] The DataCollectorMbean: one of these from each channel in the array – lots of data here. DataCollectorMonitor-00A: 2010-11-16 21:11:28 NumHits: 835245 RunState: RUNNING NumTcal: 1319 MainboardId: f5d596cfb67c LBMOverflowCount: 0 AcquisitionLoopCount: 58071 HitRate: 626.6 NumMoni: 1767 NumSupernova: 1278 Another trigger bean which looks at the number of triggers reported – from time to time people ask for real-time feeds on this information – would be nice to pipe to IceCube Live and displace on a rolling strip chart manager: 2010-11-16 20:54:47: TriggerCounts: { 'MinBiasTrigger1': 91, 'SimpleMajorityTrigger3': 8853, 'CalibrationTrigger1': 8808} Monitoring System and Logging
The run configuration system (contrast with cluster configuration which establishes the setup of the DAQ processes across a cluster of data taking computers) seeks to • capture the detector hardware configuration and distribute it to the 5000 channels. • there is also the configuration of the trigger system. • the builders run pretty much without needing configuration. • There are a small number of per-run configuration items optionally configured for the string hubs. • Finally the run configuration explicitly spells out which trigger and builder components are participating in a run • The hubs themselves are auto-magically determined based on the list of channels called out for a particular run. • Needless to say, the configuration is a complex beast: In a typical 79-string run we configure over 207k adjustable parameters! • one of the design goals was to be able to get the DAQ started with minimal configuration (OK, point taken, minimal aside from the other 200,000 configuration items) necessary. I admit that the configuration system is a bit of a monster even when we have been paying attention to it, but here’s how it works: • The user via IceCube Live starts a run with a certain configuration tag – just an ASCII string that typically describes an important feature of the configuration. • “.xml” is appended to This tag and a file by that name is sought in a well-defined location. This is called the “top-level” configuration. • The top level references a trigger configuration xml and one or more DOM configuration XMLs the latter which hold most of the configurable items. These are also sought in a filesystem at a well-defined location • Each component is passed this tag and each component can scan its filesystem for whatever information it needs to configure itself or its dependents (like the DOMs in the case of the StringHub). • The complete set of active XML configuration files is pushed out along with deployment of the java binaries to each component. Dave will cover the cluster configuration system in his discussion of the DAQ deployment architecture. The DAQ Run Configuration System
The Payload System • One of the specific points requested in the charge was the suitability of the payload system in the future. Without getting into a full-blown code review (which we should really undertake) here are some thoughts on the payload system: • DAQ holds most of it information in java byte buffers which get transmitted over the network or held in temporary pens awaiting their fate. • The Java byte buffer is a place to hold, uh, well bytes • It doesn’t any structure on the bytes in the buffer as it should not – it’s a completely generic container. • All DAQ quantities have some common features, however, like message type, length, usually a timestamp (the 64-bit # of 0.1 ns ticks since January of any year), maybe a channel ID. • So the payload system was invented to deal with this. Things like i/O engines could then have some more structure when dealing with these entities. • The issue with the payload system is that it’s IMO a bit difficult to extend – it’s not the payloads themselves but the code that deals with the payloads. It’s also been joined at the hip with the byte buffer caching system which is now dead so it should be expunged from the Payloads – that alone would probably clear up some complexity. Data Formats Described in the wiki article “payloads” Data Rates, Payloads, & Formats
Dave Glowacki – mostly DAQ • Chef du CCB was KSB < 9/10 • Event Builder • String Hub Sender component • Trigger structure • Payloads • Python framework – CnCServer … • Everything else not covered • John Jacobsen • Now mostly IceCube live • Some DOM level support and DOR driver • Did DAQ logging work and Python framework • User documentation • Kael Hanson – 0.2 DAQ • StringHub front half • Splicer • DAQ mid-level data inspection and debugging • Some configs • Mark Krasberg - ? • Configuration XMLs for the DOMs • Also • Alberto Marotta – SMT trigger hang rewrite • Thorsten Gluesenkamp – Slow MP trigger DAQ Manpower
Well, this is a problem • Alex made observation that poor documentation is an indicator of understaffing • There is a good user-level document that WOs say is helpful: it is written and maintained by JEJ • We don’t have much developer documentation. • Configuration system – which is a complex system and would be a good place to begin for us as much as anyone – is not really documented. I often have to poke into the code to refresh my memory. • We’ve been occupied with (A) making it work; (B) making it work better to now. • The DAQ would make a good NIM paper. Documentation