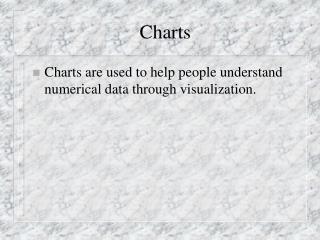
Introduction to Control Charts: XmR Chart
220 likes | 1.28k Vues
Introduction to Control Charts: XmR Chart. Farrokh Alemi, Ph.D. Purpose of Control Chart. To judge whether change has led to improvement. To visually tell a story of changes in a key measure over time. UCL. Observations. LCL. Elements of Control Chart. X-axis shows time periods

Introduction to Control Charts: XmR Chart
E N D
Presentation Transcript
Introduction to Control Charts: XmR Chart Farrokh Alemi, Ph.D.
Purpose of Control Chart • To judge whether change has led to improvement. • To visually tell a story of changes in a key measure over time. Farrokh Alemi, Ph.D.
UCL Observations LCL Elements of Control Chart • X-axis shows time periods • Y-axis shows the observation values • UCL line shows the upper control limit • LCL line shows the lower control limit • 95% of data should fall within UCL and LCL • Values outside the control limits are likely to be statistically significant Farrokh Alemi, Ph.D.
Definition of Statistical Control • Variation occurs in any outcome of interest over time. • In a stable situation, some variation will occur just by chance, but it will be predictable over time. Statisticians call this “common cause” variation or “within control limits.” • If there is a significant change, data points will show up outside the range expected for chance variation alone. Statisticians call this “special cause” variation or “outside control limits.” • A control chart allows us to detect statistically important changes. Farrokh Alemi, Ph.D.
Which Chart is Right? • For different outcomes different control charts are appropriate. • Click here to see which chart is appropriate for the outcome you have in mind. • This presentation focuses on one type of chart named XmR chart. Assumptions of XmR chart Farrokh Alemi, Ph.D.
Assumptions of XmR charts • There is one observation per time period. • Patients’ case mix or risk factors do not change in important ways over the time periods. • Observations are measured in an “interval” scale, i.e. the observation values can be meaningfully added or divided. • Observations are independent of each other, meaning that knowledge of one observation does not tell much about what the next value will be. Farrokh Alemi, Ph.D.
Moving Range • An XmR chart is based on the absolute differences between consecutive values, displayed as a “Moving Range” • Even when observations come from non-normal distributions, differences in consecutive values form a normal distribution as the number of observations increases Farrokh Alemi, Ph.D.
Calculating the Moving Range • The number of observations is “n.” • The absolute value of the difference between consecutive values is the moving range, “R” • An example follows Farrokh Alemi, Ph.D.
Example Data Farrokh Alemi, Ph.D.
Calculating the Average Moving Range Add the differences and divide by n minus one to get the average moving range. Mean R = |(Xt - Xt-1)| / (n-1) Farrokh Alemi, Ph.D.
Calculating Upper and Lower Control Limits If E is a correction constant, then: Upper Control Limit = Average of observations + E * Average of moving range Lower Control Limit = Average of observations - E * Average of moving range Farrokh Alemi, Ph.D.
Correction Factor Depends on Number of Time Periods Farrokh Alemi, Ph.D.
Calculating Upper and Lower Control Limits E for 8 time periods is 1.054 Farrokh Alemi, Ph.D.
Plot the Control Chart • Plot the x and y axis • Plot the observations • Plot the upper control limit • Plot the lower control limit • Variation among observations that fall between control limits is likely due to chance Farrokh Alemi, Ph.D.
Interpret the Control Chart • Points outside the limits represent real changes in the outcome of interest • The observation at time period 4 falls below the LCL; it is unlikely that this is due to random chance events • The next step is to determine the possible causes of this significantly different observation Farrokh Alemi, Ph.D.
Share the Results With Others • Control charts are effective ways to visually tell a story • Distribute the chart by electronic media, as part of a newsletter, or as an element of a story board display • Show that you have verified any assumptions, check that your chart is accurately labeled, and include your interpretation of the finding Farrokh Alemi, Ph.D.
Purpose of Control Chart Elements of Control Chart Definition of Statistical Control Which Chart is Right? Assumptions Moving Range Calculating Moving Range Example Data Calculating Average Moving Range Calculating Control Limits Plot the Control Chart Interpret the chart Share the Result Index of Contents Farrokh Alemi, Ph.D.