Download

1 / 26
260 likes | 447 Vues
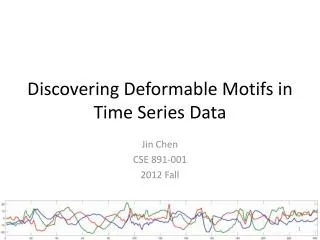
Enumeration of Time Series Motifs of All Lengths. Abdullah Mueen Department of Computer Science University of new Mexico. Example: Repeating Pattern (Motif). 30. 20. 10. 0. 0. 2000. 4000. 6000. 8000. 10000. Chiu et al. KDD 2003. 0. 100. 200. 300. 400. 500. 600. 700. 800.

E N D
Enumeration of Time Series Motifs of All Lengths Abdullah Mueen Department of Computer Science University of new Mexico
Example: Repeating Pattern (Motif) 30 20 10 0 0 2000 4000 6000 8000 10000 Chiu et al. KDD 2003 0 100 200 300 400 500 600 700 800
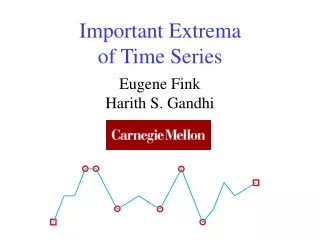
Motivation: Enumerating Motifs Find the most similar pairs of time series at every lengths. Brown A E X et al. PNAS 2013;110:791-796
Outline • 1.Bounding correlation • 2.Enumerating motifs of all lengths • Intuitive Example • Experimental Results • Case Study: Activity Recognition • 3.Conclusion
Correlation • Advantage: • 1. Scale and Shift invariant • 2. Linear scans to compute • Disadvantage: • 1. Don’t consider warping • 2. Is not a metric
10 9 8 7 Bounding Euclidean Distance 6 5 4 3 2 3 4 5 1 Values Changed 4 3 2 1 0 -1 -2 -3 -4 1 2 3 4 5 With Normalization Without Normalization
Intuition Append 20 and re-normalize Append 10 and re-normalize Normalized 2 2 2 1.5 1.5 1.5 1 1 1 0.5 0.5 0.5 0 0 0 -0.5 -0.5 -0.5 -1 -1 -1 -1.5 -1.5 -1.5 -2 -2 -2 1 2 3 4 5 1 2 3 4 5 1 2 3 4 5 Length 5 Length 5 Length 4
35 30 Bounding Euclidean Distance 25 20 25 24.5 Normalized Distance 24 15 23.5 23 22.5 10 22 21.5 21 5 20.5 20 2 2.1 2.2 2.3 2.4 2.5 2.6 2.7 2.8 2.9 3 0 x 105 x 105 0.5 1 1.5 2 2.5 3 3.5 4 4.5 5 Pairs in ascending order of distances
Outline • 1.Bounding correlation • 2.Enumerating motifs of all lengths • Intuitive Example • Experimental Results • Case Study: Activity Recognition • 3.Conclusion
-7 -7.5 -8 Intuition -8.5 0 1000 2000 3000 4000 5000 6000 7000 8000 9000 10000 x 103
-7 -7.5 -8 Intuition -8.5 0 1000 2000 3000 4000 5000 6000 7000 8000 9000 10000 x 103
Outline • 1.Bounding correlation • 2.Enumerating motifs of all lengths • Intuitive Example • Experimental Results • Case Study: Activity Recognition • 3.Conclusion
4 2 Sanity Check 0 White Noise -2 0 1000 2000 3000 4000 5000 6000 5 5 5 5 0 0 0 0 (4) (3) (1) (2) -5 -5 -5 -5 1380 1400 1420 1440 1460 1320 1340 1360 1380 1400 1420 2200 2300 2400 600 700 800 Length :87 Length :105 Length :299 Length :299 http://www.cs.unm.edu/~mueen/Projects/MOEN/index.html
x 105 x 104 18 7 Smart Brute Force Smart Brute Force 16 6 EEG EEG Experimental Results: Scalability Random Walk 14 EOG EOG 5 Random Walk 12 Iterative MK 4 10 Execution Time in Seconds Execution Time in Seconds 8 3 6 2 4 1 2 0 0 10 1 2 3 4 5 6 7 8 9 0 2 4 6 8 10 12 14 16 x 102 x 104 Range of Lengths (maxLen-minLen+1) Data Length (n)
Outline • 1.Bounding correlation • 2.Enumerating motifs of all lengths • Intuitive Example • Experimental Results • Case Study: Activity Recognition • 3.Conclusion
F F F E E E D D D D D D C C C B B A A A A Activity Recognition z 0/2 Leg y 0/2 x 2/4 1/4 z 1/2 y Arm x 1/2 z 0/3 y 0/4 Hand x 0/2 z 0/4 y 0/4 Hip x 0/4 0 0.5 1 1.5 2 2.5 3 x 10⁴ H. Pohl et al. SMC 2010
x 103 x 102 8 12 7 Experimental Results 10 n=10k n=10k 6 n=20k n=20k n=40k n=40k 8 5 n=80k n=160k Execution Time in Seconds Execution Time in Seconds 4 6 3 4 2 2 1 0 0 0.1 0.2 0.3 0.4 0.5 0.6 0.7 0.8 c 4 6 8 10 12 14 K
-7 x 10³ 1.634 1.636 1.638 1.64 1.642 1.644 1.646 1.648 1.65 9100 9120 9140 9160 9180 9200 9220 9240 9260 9600 9650 9700 9750 9800 9850 9900 8800 8850 8900 8950 9000 5 5 5 5 5 5 -7.5 -8 Sample Output -8.5 0 1000 2000 3000 4000 5000 6000 7000 8000 9000 10000 0 0 0 0 0 0 -5 -5 -5 -5 -5 -5 3450 3500 3550 3600 3650 7050 7100 7150 7200 7250 7300 7350 7400 3960 3980 4000 4020 4040 4060 4080 4100 4120 5260 5280 5300 5320 5340 5360 5380 5400 5420 5440 x 104 Length :373 Length :255 Length :186 Length :187 http://www.cs.unm.edu/~mueen/Projects/MOEN/index.html
x1.5x10-3 Time Series Join 2 2 1.5 1.5 1 1 Correlation Length-adjusted Correlation 0.5 0.5 Best Match 0 0 100 200 300 400 500 600 700 800 Lengths
8000 6000 Motif Covering Covering Motifs Locations of the First Occurrences 4000 2000 0 0 50 100 150 200 250 300 350 400 Length