Download

1 / 16
160 likes | 287 Vues
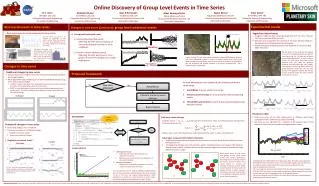
Exact Discovery of Time Series Motifs. This document was created to support our paper. It contains additional experiments and details which we could not fit into the paper.

E N D
Exact Discovery of Time Series Motifs This document was created to support our paper. It contains additional experiments and details which we could not fit into the paper.
Sandeep Tata (2007). Declarative Querying For Biological Sequences. Ph.d Thesis, The University of Michigan. Advisor Jignesh M. Patel. • In our paper we claimed that FLAME does not give exact motifs with respect to the raw time series. Here we make this clearer. • Suppose we have three time series… • A = 9.9, 50.1, 89.9, 49.9 • B = 0.1, 59.9, 80.1, 40.1 • C = 10.1, 49.9, 90.1, 50.1 • Assume they are discretized using the FLAME scheme, with each bucket covering a range of ten (i.e [0 to 9.999], [10 to 10.999], [20 to 20.999] etc), and we thus have.. • A = A,F,I,E • B = A,F,I,F • C = B,E,J,F • Note that the squared Euclidean distance between A and B is 384.16, but the distance between A and C is only 0.16. In this trivial dataset, A and C are the true motifs. • However, under the FLAME mapping, A and B are identical, but A and C have a distance of 4. • Note that it might be possible to fix this with a SAX-like lower bound, however this has not been done, and it would require significant overhead, since many false positives would have to be checked
6 Additional examples of the motif 5 4 3 2 1 0 -1 Instance at 20,925 Instance at 25,473 -2 -3 0 50 100 150 200 250 300 350 400 4 x 10 3 2 1 Approximately 14.4 minutes of insect telemetry 0 10,000 20,000 30,000 0 This is from DQmatixC, row 19 Note that the end of this row is padded with some zeros, so only the first 33,021 datapoints are used 4 x 10 3 Instance at 3,664 Here is the entire dataset 2 Instance at 9,036 1 0 100 200 300 400 500 This is from DQmatixD1, row 16 Note that the end of this row is padded with some zeros, so only the first 78,254 datapoints are used Here is the entire dataset
acid_anhydrides_s_000031.png, acid_halide_s_000035.png acetaminophen_s_000058.png, albuterol_s_000042.png african_love_grass_s_000016.png, african_millet_s_000013.png acyl_halide_s_000091.png, acyl_halide_s_000092.png aldehyde_s_000059.png, alkene_s_000042.png arctostaphylos_alpina_s_000039.png, asplenium_platyneuron_s_000035.png acyl_anhydrides_s_000044.png, alkyl_radical_s_000068.png Here are the file names of the near duplicated images discovered by our algorithm
In the following slides we give some more information about the Beet leafhopper example in the paper.
Economic Importance • Only known vector of beet curly top virus in North America UC IPM Online CDFA
History On Sugar Beets • First reported in Nebraska in 1888 • Outbreak in 1925 in California resulted in loss of one third of the sugarbeet crop throughout the Sacramento Valley, and in a total loss of all late plantings in both the San Joaquin Valley and southern Salinas Valley (Severin & Schwing, 1926) • Closure/part time operation of sugarbeet refinery factories, complete abandonment of thousands of acres of planted or prospective land for sugarbeet in Western U.S.(Bennett, 1971) • So severe in the Salinas Valley that in 1947 a permanent research laboratory of plant pathology, entomology, and plant breeding was established by the USDA to work on controlling BCTV outbreaks (Wisler & Duffus, 2000). • Resistant varieties became available in 1933 (Owen et al., 1938) H.H.P. Severin, 1930
History On Tomatoes • San Joaquin Valley in 1948 and 1950, it was estimated that 80% of the tomato crop was lost or damaged by BCTV (Bennett, 1971) • Today commercial and recreational growth of tomatoes in the western United States is still limited in many areas by the incidence of BCTV • Breeding program to develop BCTV resistant tomato varieties was established in Utah in 1930 by the U.S. Department of Agriculture (Martin, 1970). • Resistant varieties have small fruit of poor quality (Martin, 1970) • Resistant lines only confer a reduction to the initial infection • Once resistant varieties are infected, they react in the same way as susceptible varieties (Thomas & Martin, 1971, 1972) H.H.P. Severin, 1930
Biological control Not effective due to migratory patterns Chemical Control Malathion treatments applied to thousands of acres of overwintering areas Insecticides on host plants Resistant plants Increasingly important Breeding Area Control Measures esrpweb.csustan.edu/ gis/rp/lom.html
Resistant Plants • Develop BCTV resistant plants with horticulturally favorable properties • Determine mechanisms of resistance • Resistance in tomatoes • Appears to be due to change in feeding behavior • In order to experimentally test if the mechanism of resistance is an effect on vector feeding behavior, we need to develop a methodology to study the feeding behavior of beet leafhopper.
What EPGs Measure • Fluctuations in voltage level • Occur in distinct patterns called waveforms • Each waveform is associated with a specific feeding behavior • Before EPGs can be used to study feeding behavior, the waveforms must first be experimentally correlated with specific feeding behaviors
Example of beet leafhopper EPG recording Example of beet leafhopper EPG recording Amplitude (V) Time 5 min
In addition to telemetry, we have a video stream we can refer to
1 sec 1 sec Waveforms 5a and 5b Lei et al., 1999 Waveforms E(pd), (1) and E(pd), (2) Lei et al., 1999 1 sec 1 sec Waveforms D2 and D3 Stafford, unpublished Waveforms E1 and E2 Prado and Tjallingii, 1994 Some examples of manually discovered motifs. (Note that entomologists don’t use the term motifs)
6 Additional examples of the motif 5 4 3 2 1 0 -1 Instance at 20,925 Instance at 25,473 -2 -3 0 50 100 150 200 250 300 350 400 Here is the raw data in which we found the motif shown below This is from DQmatixD1, row 16