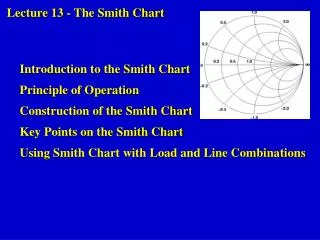
The Smith Chart
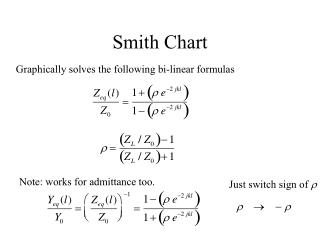
The Smith Chart. Dave Glawson – WA6CGR SBMS – October 6, 2011. What is it?. Problem Solving Aid for RF A Graphical Demonstrator of How Many RF Parameters Behave at One or More Frequencies Problems Solved Manually One Frequency at a Time. Terms. Impedance ( Z 0 ) ( R + j X , R - j X )

The Smith Chart
E N D
Presentation Transcript
The Smith Chart Dave Glawson – WA6CGR SBMS – October 6, 2011
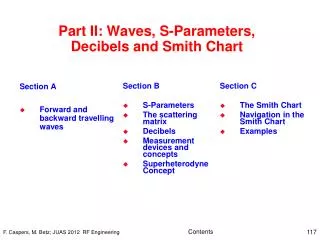
What is it? • Problem Solving Aid for RF • A Graphical Demonstrator of How ManyRF Parameters Behave at One or More Frequencies • Problems Solved Manually One Frequency at a Time
Terms • Impedance (Z0) (R+jX, R-jX) • Admittance (Reciprocal of Impedance) (Y0, =Z-1=1/Z) • Reactance +jX, -jX • SusceptanceG+jB, G-jB (Reciprocal of Reactance) • Resistance in Ohms • Conductance in Siemens (Mhos) (Reciprocal of Resistance) • Characteristic Impedance of Z0 =Characteristic Admittance of Y0
Terms • Characteristic Impedance (Z0) is Normalized • Z0 = 50Ω Has No Special Significance • For minimum loss Z0 =77Ω • For maximum breakdown voltage Z0 =30Ω • For minimum temperature rise Z0 =60Ω • Γ (Gamma) = (ZL-Z0) / (ZL+Z0)
Determine the “Q” of Your Amplifier • Select the “Mean” Frequency of Your Band • Divide the “Mean” Frequency by the expected 3dB Bandwidth • Q=Fo/3dB BW • Example Center of Frequency Range = 450 MHz • 3 dB Bandwidth of 100 MHz • Q = 450/100 = 4.5
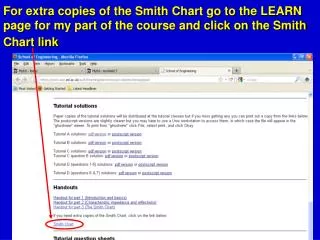
References • http://www.ham-radio.com/sbms/smithchart • WinSMITH • Example – MRF327