Evaluating Operational Performance with Balanced Scorecard
450 likes | 491 Vues
Understand the decentralization of operations in companies, responsibility centers, and the importance of performance evaluation systems. Learn about the balanced scorecard, key performance indicators, and using ROI, RI, and EVA to evaluate investment centers.

Evaluating Operational Performance with Balanced Scorecard
E N D
Presentation Transcript
Performance Evaluation and the Balanced Scorecard Chapter 12
Objective 1 Explain why and how companies decentralize
Decentralized Operations • Operations are split into divisions • Advantages: • Frees top management time • Supports use of expert knowledge • Improves customer relations • Provides training • Improves motivation and retention
Decentralized Operations • Disadvantages: • Duplication of costs • Problems achieving goal congruence
Responsibility Centers • Subunit whose manager is accountable for specific activities • Cost center • Revenue center • Profit center • Investment center
Objective 2 Explain why companies use performance evaluation systems
Goals of Performance Evaluation Systems • Promoting goal congruence and coordination • Communicating expectations • Motivating Unit Managers • Providing Feedback • Benchmarking
Limitations of Financial Performance Measures • Management needs both • Lag indicators • Lead indicators • Tendency to focus on short-term achievements
Objective 3 Describe the balanced scorecard and identify key performance indicators for each perspective
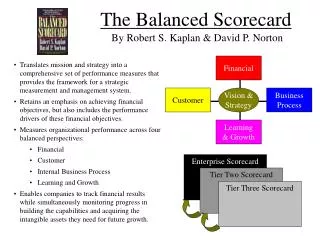
Balanced Scorecard • Measure company’s activities in terms of its vision and strategies • Financial and operational performance measures are considered • Link company goals to key performance indicators
COMPANY GOALS CRITICAL FACTORS (customer satisfaction, operational efficiency, employee excellence, financial profitability) KEY PERFORMANCE INDICATORS (KPIs) (market share, yield rate, employee training hours, revenue growth)
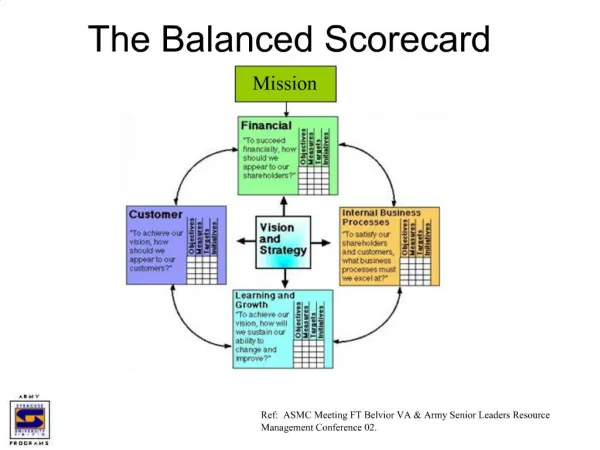
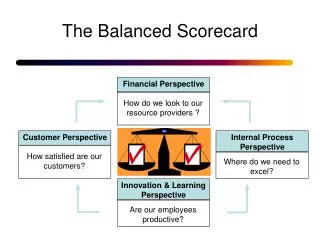
Four Perspectives • Financial perspective • Customer perspective • Internal business perspective • Learning and growth perspective
Financial Perspective • How do we look to shareholders? • Strategy to increase company profits • Increase revenue growth • Increase productivity
Customer Perspective • How do customers see us? • Strategy - Customer satisfaction • Product price • Product quality • Sales service quality • Product delivery time
Internal Business Perspective • At what business processes must we excel? • Three factors • Innovation • Operations • Post-sales service
Learning and Growth Perspective • Can we continue to improve and create value? • Three factors • Employee capabilities • System capabilities • Company’s climate for action
1. Financial Perspective- “How do we look to shareholders?” E12-16 4. Learning and Growth Perspective-“Can we continue to improve and create value?” 2. Customer Perspective-“How do customers see us?” 3. Internal Business Perspective- “At what business processes must we excel?”
1. Financial Perspective Revenue Productivity Climate for Action 4. Learning and Growth Perspective 2. Customer Perspective Employee Capabilities System Capabilities Price Sales service Quality Delivery time 3. Internal Business Perspective Innovation Operations Postsales service
E12-18 • Customer perspective • Learning and growth perspective • Financial perspective • Internal business perspective • Learning and growth perspective • Internal business perspective • Customer perspective • Internal business perspective
E12-18 • Customer perspective • Financial perspective • Internal business perspective • Learning and growth perspective • Internal business perspective • Financial perspective • Internal business perspective • Customer perspective
E12-18 • Learning and growth perspective • Financial perspective • Customer perspective • Internal business perspective • Internal business perspective • Learning and growth perspective • Internal business perspective
Objective 4 Use performance reports to evaluate cost, revenue, and profit centers
Performance Reports • Report financial performance of responsibility centers • Cost center – focus on flexible budget variance • Revenue center – focus on flexible budget variance and sales volume variance • Profit center – focus on flexible budget variance • Includes allocated charges from service departments
E12-19 $2,100 U 8.08% U 500 F 3.57% F 3,000 U 13.04% F 1,000 U 9.09% U 0 0 700 F 14.00% F 4,900 U 4.71% U
Objective 5 Use ROI, RI, and EVA to evaluate investment centers
Investment Centers • Financial evaluation must measure • Income generated • Effective use of center’s assets • Performance measures • Return on investment (ROI) • Residual income (RI) • Economic value added (EVA)
Operating income Sales Sales Total assets Return On Investments Operating income ÷ Total assets Or X
Operating income Sales Operating income Sales Sales Total assets Sales Total assets ROI X Sales margin = Capital turnover =
ROI Advantages • Expanded equation provides additional information • Can be used to compare across divisions and with other companies • Useful for resource allocation
Professional: $173,000 ÷ $420,000 = 41.19% Residential: $62,000 ÷ $188,000 = 32.98% E12-21 Req 1 ROI = Operating income ÷ Total assets
Professional: $173,000 ÷ $1,030,000 16.80% Residential: $62,000 ÷ $555,000 11.17% E12-21 Req 2 Sales Margin = Operating income ÷ Sales
Professional: $1,030,000 ÷ $420,000 2.4524 Residential: $555,000 ÷ $188,000 2.9521 E12-21 Req 3 Capital Turnover = Sales ÷ Total Assets
Professional: 16.80% x 2.4524 41.20% Residential: 11.17% x 2.9521 32.97% E12-21 Req 4 ROI = Sales margin x Capital turnover
Residual Income • Compares division’s operating income with minimum operating income expected given the size of the division’s assets • Positive – income exceeds target rate of return • Negative – income does not meet target rate of return
RI Operating income – Minimum acceptable income Minimum acceptable income = Target rate of return x Total assets
RI Advantages: • Promotes goal congruence better than ROI • Incorporates management’s minimum required rate of return • Can use different target rates or return for divisions with different levels of risk
Professional: $173,000 - ($420,000 x 25%) = $68,000 E12-22 Req 1 Residual Income = Operating income – Minimum acceptable income Residential $62,000 - ($188,000 x 25%) = $15,000
Economic Value Added After-tax operating income – [(Total assets – Current liabilities) x WACC%] WACC% - weighted average cost of capital
Professional: ($173,000 x 70%) – [($420,000 - $150,000) x 15%] $80,600 E12-22 Req 2 EVA = (After-tax operating income) – [(total assets – current liabilities) x WACC%] Residential ($62,000 x 70%) – [($188,000 - $68,000) x 15%] $25,400
EVA Advantages • Considers wealth created just for investors and long-term creditors • Promotes goal congruence
Limitations of Financial Performance Measures • Measurement issues - how to define “total assets” • Short-term focus