Download

1 / 34
350 likes | 701 Vues
Is U. S. Economic Growth Over? Lessons from the Long 20 th Century. Robert J. Gordon, Northwestern, NBER, CEPR, OFCE EPS Dinner, Swissotel, Chicago, January 7, 2012. What Are You Talking About??? The End of Economic Growth?.

E N D
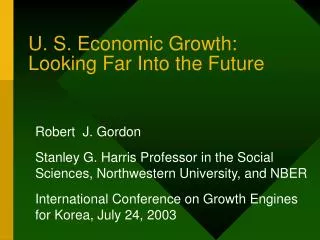
Is U. S. Economic Growth Over?Lessons from the Long 20th Century Robert J. Gordon, Northwestern, NBER, CEPR, OFCE EPS Dinner, Swissotel, Chicago, January 7, 2012
What Are You Talking About???The End of Economic Growth? • The central theme: technological change is not continuous. The Great Inventions involved a one-time-only set of changes. • One-time-only changes included horses to trucks, outhouses to indoor plumbing, housewives carrying buckets to running water, and many more • Maybe this seems obvious about horses and outhouses, but once you accept that, you’ve been drawn into my central thesis. Economic growth is not a continuous long-run process but an artifact of a unique three-century period of human history.
Further Qualifications to the Title • This talk does not predict the end of economic growth in general -- It is specifically limited to the U. S. • It does not even predict the end of innovation in the U. S., just that innovation will face increasing headwinds • No implications for other countries: China, India, and everybody else can catch up and even move ahead
What is “The Long 20th Century”? • Commonplace term in European History: The long 19th century is from the French Revolution of 1789 to the start of WW I in 1914 • In parallel, the long 20th century for the U.S. is from the end of the Civil War (1870) to the previous business cycle peak (2007) • This talk is NOT about the great recession, the global economic crisis, or anything that has happened since 2007. The US economy had plenty of problems already in 2007. • Three industrial revolutions (IR) propelled growth. IR #1 (1760-1830), IR #2 (1875-1900), and IR #3 (electronics after 1960 until now).
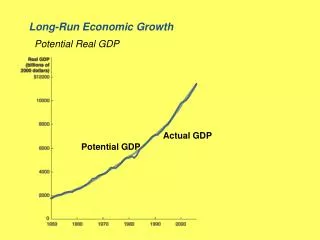
Outline of Talk • UK-US economic growth in context, 1300-2050 • Examples of low standard of living in 1870 • Quantity/quality of consumption and of work • Identifying the Great Inventions of IR#1 and IR#2. • Which dimensions of human existence did the Great Inventions of IR #2 improve? • Which dimensions of human existence has a broadly defined IR#3 improved, and when? • The six headwinds • Even if innovation continues as in the last two decades, the headwinds will push growth down below any precedent
We Start at 1870 at the Dawn of IR #2 • 1870, a natural transition point – end of Civil War, golden spike, and start of Census of Manufacturing • Dimensions of Progress by 1870, stemming from UK-led IR #1 • Replacing human labor by machine power (steam, water) • Increasing speed and reliability of movement (RR, steamships) • Increasing speed of communications (RR, telegraph)
Common Features of 1870 Housing,Rural and Urban: Smoke and darkness • Lack of enclosed iron stoves that could control heat, invented after 1870. Housewives in 1870 had only the open hearth, with all its energy inefficiency that would curl the hair of the modern Sierra Club. • Second, there was no electricity. Light for working and reading at night consisted of lamps fueled by kerosene or whale oil. “Air pollution inside the home”
THE BIGGEST DEAL OF ALL: LACK OF RUNNING WATER • Every drop of water for laundry, cooking, and indoor chamber pots had to be hauled in by the housewife, and the waste water hauled out. • One source claims that the average North Carolina housewife in 1885 had to walk 148 miles per year while carrying 35 tons of water. • Water in, water out. The water taken out was dirty and/or disgusting. Coal or wood in for fires, ashes out. • We all talked about “women’s lib” in our youth; nothing has liberated women more than running water in the period 1890-1930 • Were summers better than winters in 1870? • Window screens had not been invented in 1870!
Horses (and Pigs) on Every Urban Street • Urban America during 1870-1900 was utterly dependent on the horse • Horses required expenditures each year for food and maintenance equal to their capital cost • Imagine if your $30,000 car required every year $30,000 additional for fuel and maintenance • The average horse produced 20 to 50 pounds of manure and a gallon of urine daily, applied without restraint to stables and streets. The daily amount of manure worked out to between 5 and 10 tons per urban square mile, all of which required gruesome human labor to remove. • We’ll return to this: the standard of living is not just about consumption, but the quality of work
Why Life Expectancy Was So Lowin 1870 • At birth life expectancy was only 45 years in 1870 compared to 79 years recently. • Causes in 1870: infant mortality resulting from poor sanitation, water-transmitted diseases, and contaminated milk. • The first attempts at urban sanitation infrastructure emptied waste not into cesspools but into nearby rivers with no filtration. The theory at the time was that “the rivers cleaned themselves.” • Further causes: hard physical labor, injuries, RR deaths, polluted indoor air, violence, lynchings • A surprising fact about life expectancy
The Standard of Living InvolvesNot Just the Quality of Consumption but the Quality of Work • We can rate the “quality of work” as “pleasant” and others as “unpleasant.” • Take 13 major occupational groups, we have data on the composition going back to 1870 • Classify them as pleasant or unpleasant • In 1870 87% of jobs were unpleasant, only 22% in 2010 • And each given job in an “unpleasant” category, say farmers, has utterly changed • 1870: farmers pushed a plow behind a horse (see Spielberg’s “War Horse”) • 2011: Farmers drove in an air conditioned enclosed John Deere tractor that almost drove itself with GPS.
How Did the Great IR #2 InventionsChange 1870 Living Conditions? • The great inventions of IR #2 can be clustered into five groups. Each had a primary breakthrough invention that occurred between 1860 and 1900. • Electricity: electric light and motors, leading to home appliances • Internal combustion engines: motor vehicles, air transport, suburbs, supermarkets, and superhighways • Running water and indoor plumbing, central heating • “Rearranging molecules”. Petroleum, natural gas, chemicals, plastics • Entertainment and communications: • Telegraph (1844), telephone (1876), phonograph (1877), popular photography (1880s, 1890s), radio (1899), motion pictures (1881 to 1888), and television (1924-31).
Dimensions of Progress from IR #2 • Replacing Animal Power by Motor Power • Inefficiency of horses, need to maintain horses overnight, stench, need for yucky waste removal • Replacing Human Effort • Running water, no more carrying water in and out • Oil and gas replaced coal and wood for fuel • Electric hand tools • Household appliances starting with washer and refrigerator
Human Comfort and Convenience • Replace outhouse with indoor toilet • Replace open-hearth fire by central heating • Window screens to keep out insects • Greater ease of reading with electric light • Reduced pollution as natural gas heating replaced coal and wood • Replaced shopping at the rural general store by department stores and supermarkets
Speed and Comfort of Travel • By 1870 RR had revolutionized inter-city travel but the horse still dominated intra-urban • Increased speed electric street-car compared to horse-drawn streetcar, then motor bus • Electric subway and elevated rapid transit • Motor transit: from dirt roads to interstate highways in < 100 years • Air travel, from that Swallow bi-plane in 1926 to the Boeing 707 in 1958, we haven’t gone faster since (supersonic travel abandoned)
Communication and Entertainment • Speed • 1844 telegraph, one-way communication • 1876 telephone, two-way communication • Increasing the marginal value of a leisure hour • Phonograph, recorded music • Nickelodeon to silent movies to “Gone with the Wind” • 1920 radio, 1946 television
Health • Ending horse-created diseases • Invention of the window screen • Urban sanitation: elimination of water-borne disease • Decline in infant mortality (sanitation, milk) • Regulation of “Jungle” outrages, FDA in 1906 • Antibiotics in 1930s-40s
Within One Century, Life had Utterly Changed • Break point, 1970: The Great Inventions of IR #2 had been fully absorbed • Interstate highway system almost completed • Air conditioning universal in commerce and widespread in residential homes • Air travel completely converted to jet, no further increase in speed • Consumer appliances universal, only the microwave oven lay ahead • Post-1972 productivity growth slowdown: running out of ideas
IR #3, Big Benefits of Electronics Came Early • Replacing human effort by machines • 1950s, elevator operators • 1961: industrial robot introduced by GM • 1960s, telephone operators • 1960s-70s, computer-generated bank statements and telephone bills eliminated tedious clerical labor • Credit cards, my AX card is stamped “1968” • 1970s, memory typewriters replaced boring retyping • 1970s, airline reservation systems
Internet Revolution?How Long Ago did the Main Benefits Arrive? • 1974: first bar-code scanner, 1980s ATMs • 1980s. Word-processing, word-wrap, elimination of repetitive typing. Secretaries begin to disappear from Econ departments • 1990s. E-mail, web, e-commerce • Electronic catalogs in libraries and auto parts • A qualitative difference in the importance of inventions since 2001
Difference in Post-2001 Inventions • From 1960 to 2000, many IR #3 inventions involved the direct replacement of human labor by machine power • From the earliest telephone bills & bank statements to replacement of paper catalogues by electronic catalogues • Since 2001 the most prominent inventions replace one form of entertainment or communication by another • Walkman to ipod, cell phone to smart phone, laptop to ultrabook and ipad
How Important Were IR #3 Innovations during 2001 – 2011? • A thought experiment to value IR #2 vs. IR #3 • Choice A: You get 2001 electronic technology and get to keep running water and indoor toilets. But you can’t use any electronic invention introduced since 2001. • Choice B is that you get everything invented in the past decade, right up to facebook, twitter, and the ipad 2, but you have to give up running water and indoor toilets. There’s no cheating, you have to do it. • Which do you choose?
What About the Future of IR #3?The Folly of Forecasting • In 1876 an internal memo at Western Union, the telegraph monopolist, said that “the telephone has too many shortcomings to be considered as a serious means of communication.” • In 1927, a year before the first talking motion picture, the head of Warner Brothers said “Who the hell wants to hear actors talk?” • In 1943 Thomas Watson, president of IBM, said “I think there is a world market for maybe five computers.” • In 1981 Bill Gates, defending the capacity of the first-generation floppy disk, claimed that “640 kilobytes out to be enough for anyone.”
Last Section of Talk • The evidence is all around us that, while innovation continues at a frenetic pace of innovation, the effect of innovations on the basic quality of life and work is diminishing • We could do these things only once, not again • Replace the horse with the motor car and truck • Replace back-breaking labor of housewives by consumer appliances and running water • Achieve an even 72o temperature year-round Travel at 550 mph on a jet plane instead of at the speed of a horse
But Let’s Heed the Lessons from the Follies of Forecasting • Let’s pretendthat the pace of innovation will continue at the same pace as in 1987-2007 • These are only two of the six “headwinds” putting the brakes on the ability of innovation to push forward the U. S. standard of living
The First Two Headwinds,incorporated into 2007+ Forecast • #1. Demographic Dividend is Reversed • Y/N grew faster than Y/H 1970-1995 because of female entry to the labor force and Baby Boom bulge of labor-force entry • Y/N will grow slower after 2011 due to Baby-Boom retirement • #2. Plateau of Educational Attainment • Cost inflation in higher education, mounting student debt distorts life choices • Poor math-science scores in OECD cross-country tests • Achievement gap of black and hispanic minorities
Four More Headwinds • #3. Inequality: growth in median income is much slower than in statistical averages for income per capita • 1993-2008. Growth of average real household income = 1.3% • Growth in bottom 99%, 0.75%. Top 1%, 3.9% • Top 1% captured 52% of income gains during 1993-2008 • #4. Globalization linked with IT: Hurts the leading nation more than others. Outsourcing and those radiologists in India (let’s hear from Alan Blinder). • #5. Environment: Payback for past growth, sacrifice for emerging market growth (is it fair?) • 1901 full steam ahead, environment be damned • #6. Twin deficits: consumer and government debt overhang. However slow is growth in production per capita, consumption per capita will grow slower.
An Exercise in Subtraction • Start with the same pace of innovation for 2007-2027 as occurred in 1987-2007. This is a very optimistic assumption. That would imply future growth of real GDP per capita of 1.9% • Subtract the turnaround in the demographic dividend, bringing us down to 1.6%. • Subtract because educational attainment is stagnant, no longer growing. Now at 1.4%. • Growth of consumption per capita of about 1.1%, as consumers pay down their overhang of debt • For the bottom 99 percent of the income distribution, per capita consumption growth could be 0.5% to 0.6%. • Impose a carbon tax that reduces growth in non-energy consumption to 0.4% • Reform social security and medicare and pay with it partly by higher taxes and lower transfers. Now we’re down to 0.2%, just as assumed by my green line. • And all this ignores what has happened since 2007!
Questions for Our Discussion • You might ask, what are my solutions? • I have plenty, and so do many other people • I’d rather hear from you • What can we learn from differences among countries. Are Canadians or Swedes as pessimistic? Why not? • Do you accept the one-time-only interpretation of technical change? • Which headwinds should we tackle? • Your turn . . . .