Comparative Analysis of Biological Assessments in Diverse Eco-Systems
Explore how different methods of biological assessments in the Sierra Nevada mountains produced comparable results, leading to efficient integration and enhanced accuracy in detecting environmental impacts.

Comparative Analysis of Biological Assessments in Diverse Eco-Systems
E N D
Presentation Transcript
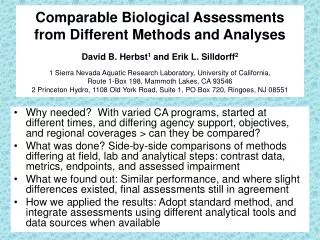
Comparable Biological Assessmentsfrom Different Methods and AnalysesDavid B. Herbst1 and Erik L. Silldorff21 Sierra Nevada Aquatic Research Laboratory, University of California, Route 1-Box 198, Mammoth Lakes, CA 935462 Princeton Hydro, 1108 Old York Road, Suite 1, PO Box 720, Ringoes, NJ 08551 • Why needed? With varied CA programs, started at different times, and differing agency support, objectives, and regional coverages > can they be compared? • What was done? Side-by-side comparisons of methods differing at field, lab and analytical steps: contrast data, metrics, endpoints, and assessed impairment • What we found out: Similar performance, and where slight differences existed, final assessments still in agreement • How we applied the results: Adopt standard method, and integrate assessments using different analytical tools and data sources when available
Region & Setting • Eastern Sierra Nevada • 40 streams: 1st to 4th order • 6000-9000 ft elevation • [drawn from a larger survey data set of >250 sites] • Impact sources: Sediment • Livestock grazing • Channel alteration
Flow Chart of Study 1. Reference Selection: Reference 24 <0.2 Rd xings/km and/or <25% Bank erosion with no pollution source YES NO Test 16 2. Concurrent collection of field data and laboratory processing CSBP SNARL USFS Community similarity Metric similarity & precision Endpoint similarity & precision Assessment agreement 3. Analysis Metric screening and selection >optimal IBI developed RIVPACS (site groups, taxa associations, etc) >optimal O/E models developed SNARL-IBI SNARL-O/E cross- comparisons CSBP-IBI USFS-IBI CSBP-O/E USFS-O/E
Precision Differences: • Though the SNARL method exhibits slightly better metric performance at DQOs of 10-25%, the IBIs and O/Es endpoints are all below DQO of 15% (based on reference data set) IBI and RIVPACS models Metrics Used for IBIs
Correlations of IBI and O/E Scores Among Methods • Scores highly correlated among methods: concordance correlations of 0.88-0.92 IBIs, and 0.84-0.88 O/Es • Close agreement in assessments among methods in most cases Most site scores from different methods are directly interchangeable and their correspondence can be further improved by: • Converting all data sets to fixed 500 count (re-sampling) • Use of the same metric sets for calculation of IBIs
Stressor Detection? Similar responses to increased sediment deposition effects, with slightly better resolution by UC-SNARL method of threshold at just over 60% FSG, and less overlap between reference and test groups
How do methods compare in terms of cost? • SNARL method with 5 replicate riffle samples taken per site is about 1.5X the cost-effort of CSBP and 3X that of the single R5.USFS.USU targeted riffle composite sample
Assessment of Impairment • Relative measure of accuracy among methods: assume test sites are impaired • How many tests are not detected (type II error) as the type I error is relaxed (low scoring references rejected)? • Threshold: at 4th of 24 references (4/24 =17% type I error) • Result: each method detects all but one test site using both IBI and O/E criteria (type II =1/16 =6%) • To what extent are methods in agreement for impairment detected and references retained? • = 83-93% site assessments agree in being judged as impaired vs. unimpaired
CONCLUSIONS: • Different methods show similar performance characteristics and assessment scores • Results had high correlation, were independent of multimetric or multivariate analysis, and showed similar accuracy in discriminating reference from test • Methods are easily calibrated and converted from existing data sets (SNARL to TRC by 500 fixed-count re-sampling) • Data sets from alternative methods offer opportunity for cross-confirmation, increased certainty in assessment, and multiple lines of evidence in identifying impacts and stressor thresholds