Download
1 / 2
20 likes | 101 Vues
This overview delves into splicing array analysis to identify regulated genes and exons for various experimental conditions. The analysis answers questions regarding gene expression and splicing amidst different conditions, uncovering involved pathways. Visualizations using Affymetrix Exon Array data, like the siPTB/nPTB effect on exon 15 of the KIAA0652 gene, are illustrated for better understanding.

E N D
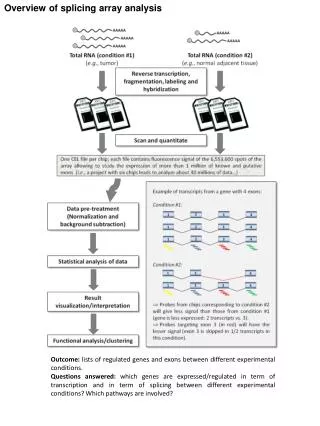
Overview of splicing array analysis Outcome: lists of regulated genes and exons between different experimental conditions. Questions answered: which genes are expressed/regulated in term of transcription and in term of splicing between different experimental conditions? Which pathways are involved?
Figure 1: Visualization systems for the Affymetrix Exon Array data: example of the siPTB/nPTB effect on exon 15 of the KIAA0652 gene A 1 2 B 1 2 C 1 2 3