Download
1 / 1
10 likes | 145 Vues
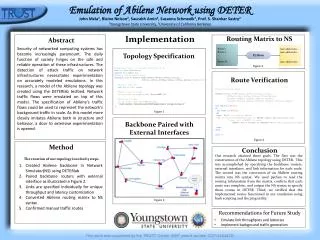
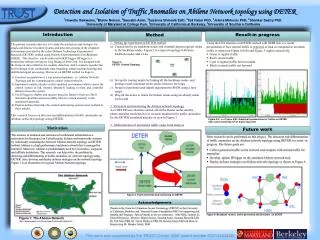
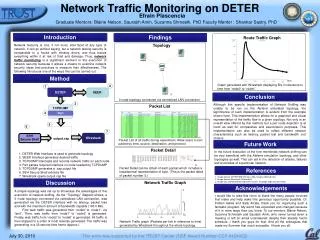
Network Traffic Monitoring on DETER. Efrain Plascencia . Graduate Mentors: Blaine Nelson, Saurabh Amin , Suzanna Shmeelk , PhD Faculty Mentor : Shankar Sastry , PhD. Introduction. Findings. Route Traffic Graph. Topology.

E N D
Network Traffic Monitoring on DETER Efrain Plascencia Graduate Mentors: Blaine Nelson, SaurabhAmin, Suzanna Shmeelk, PhD Faculty Mentor : Shankar Sastry, PhD Introduction Findings Route Traffic Graph Topology Network Security is one, if not most, vital facet of any type of network. It can go without saying, but a network lacking security is comparable to a house with missing doors, and thus leaves everything within it at risk of thief and damage. Thus, network traffic monitoringis a significant element in the execution of network security because it allows a means to examine network security ideas and practices to measure their effectiveness. The following introduces one of the ways this can be carried out. Method Packets/Tick [2] [3] Graph generated with Wireshark displaying B/s in reference to time from ‘node0’ to ‘node1’. 2 1 [1] Conclusion 3 node topology connected via centralized LAN connection DETER SEER Although this specific implementation of Network Sniffing was unable to be ran on the Abilene simulated topology, the significance of such implementation is evident from the example shown here. This implementation allows for a graphical and visual representation of the traffic flow in a given topology. Not only is an overall view offered by this method, but a per route depiction is at hand as well for comparative and examination purposes.This implementation can also be used to reflect different network characteristics such as latency, packet lost and bandwidth (not shown). Packet List 3 TCPDUMP 4 Perl 5 6 [2] 7 Packet List of all traffic during experiment. Allow users to sort packet by time, source, destination, and protocol. Future Work SSH Secure Shell Wireshark output.cap Packet Detail In the future execution of the fore mentioned network sniffing can be very beneficial with the Abilene simulation topology, and other topologies as well. This can aid in the detection of attacks, failures and anomalies of a particular network. 1. DETER Web Interface is used to generate topology 2. SEER Interface generates desired traffic 3. TCPDUMP intercepts and records network traffic on each node 4. Perl parses required interface on node needed by TCPDUMP 5. TCPDUMP generates a .cap output file 6. SSH Secure Shell extracts file 7. Wireshark opens output.cap file [2] Packet Detail can be obtain of each packet which includes a hexadecimal representation of byte. (This is the packet detail of packet number 5.) References 1. Image Source: DETER Web Interface (http://www.isi.deterlab.net/) 2. Image Source: Wireshark (Screenshot) 3. Image was altered to better represent visually the graph originally generated Discussion Network Traffic Graph Acknowledgements A simple topology was set up to showcase the advantages of this execution of network sniffing. As the “Topology” diagram shows, a 3 node topology connected via centralized LAN connection, was generated via the DETER interface with no latency, packet loss and with the maximum amount of bandwidth capable (100.0 Mb). First web traffic was generated from ‘node0’ to ‘node1’, via ‘lan0’. Then, web traffic from ‘node1’ to ‘node2’ is generated. Finally, web traffic from ‘node2’ to ‘node0’ is generated. All traffic is then stopped in a order of most recently generated. The traffic was generating in a 35 second time frame (approx.) I would like to take this room to thank the many people involved that make and help make this generous opportunity possible. Dr. Kristen Gates and Sally Alcala, thank you for organizing such a fantastic program. My world has expanded and changed because of it in more ways than you know. To our mentors, Blaine Nelson, Suzanna Schmeelk and SaurabhAmin, who never turned down a meeting or left an email unanswered despite their already hectic schedule. I thank you guys for that. And all the colleagues that made my Summer that much enjoyable. I thank you all. [2] Network Traffic graph (Packets per tick in reference to time) generated by Wireshark throughout the whole topology. • July 30, 2010 • This work was supported by the TRUST Center (NSF Award Number CCF-0424422)