1 / 2

North Fork Prairie Creek at 450 E WQ Duration Curve (2002 Monitoring Data) Site: WWL080-0001

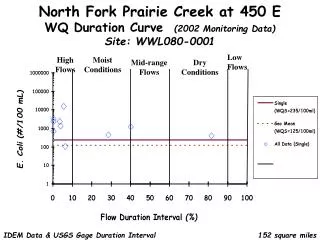
North Fork Prairie Creek at 450 E WQ Duration Curve (2002 Monitoring Data) Site: WWL080-0001. Low Flows. High Flows. Moist Conditions. Mid-range Flows. Dry Conditions. IDEM Data & USGS Gage Duration Interval. 152 square miles.

bell-lane
Télécharger la présentation

North Fork Prairie Creek at 450 E WQ Duration Curve (2002 Monitoring Data) Site: WWL080-0001

An Image/Link below is provided (as is) to download presentation Download Policy: Content on the Website is provided to you AS IS for your information and personal use and may not be sold / licensed / shared on other websites without getting consent from its author. Content is provided to you AS IS for your information and personal use only. Download presentation by click this link. While downloading, if for some reason you are not able to download a presentation, the publisher may have deleted the file from their server. During download, if you can't get a presentation, the file might be deleted by the publisher.

E N D

Presentation Transcript


  1. North Fork Prairie Creek at 450 EWQ Duration Curve (2002 Monitoring Data)Site: WWL080-0001 Low Flows High Flows Moist Conditions Mid-range Flows Dry Conditions IDEM Data & USGS Gage Duration Interval 152 square miles

  2. South Fork Prairie Creek at CR 300 EWQ Duration Curve (2002 Monitoring Data)Site: WWL080-0002 Low Flows High Flows Moist Conditions Mid-range Flows Dry Conditions IDEM Data & USGS Gage Duration Interval 152 square miles

More Related