Instrumental Analysis
Instrumental Analysis . Prof . Dr. Hisham Ezzat Abdellatef Professor of pharmaceutical analytical chemistry. Introduction to Analytical Chemistry. Background A.) ANALYTICAL CHEMISTRY : The Science of Chemical Measurements.

Instrumental Analysis
E N D
Presentation Transcript
Instrumental Analysis Prof . Dr. Hisham Ezzat Abdellatef Professor of pharmaceutical analytical chemistry
Introduction to Analytical Chemistry • Background • A.) ANALYTICAL CHEMISTRY: The Science of Chemical Measurements. • B.) ANALYTE: The compound or chemical species to be measured, separated or studied • C.) TYPES of ANALYTICAL METHODS: • 1.) Classical Methods (Earliest Techniques) • a.) Separations: precipitation, extraction, distillation • b.) Qualitative: boiling points, melting points, refractive index, color, • odor, solubilities • c.) Quantitative: titrations, gravimetric analysis • 2.) Instrumental Methods (~post-1930’s) • a.) separations: chromatography, electrophoresis, etc. • b.) Qualitative or Quantitative: spectroscopy, electrochemical methods, • mass spectrometry, NMR, • radiochemical methods, etc.
CHOOSING AN ANALYTICAL METHOD • What Factors to Consider: • What are the advantages or disadvantages of the technique versus other methods? • How reproducible and accurate is the technique? • How much or how little sample is required? • How much or how little analyte can be detected? • What types of samples can the method be used with? • Will other components of the sample cause interference? • Other factors: speed, convenience, cost, availability, skill required. • How Do We Answer or Address These Questions?
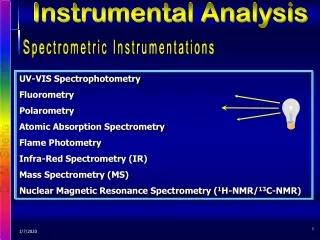
Types of Instrumental Methods: Example methods
Example: Spectrophotometry Instrument:spectrophotometer Stimulus:monochromatic light energy Analytical response:light absorption Transducer: photocell Data:electrical current Data processor:current meter Readout:meter scale
Performance Characteristics: Figures of Merit: How to choose an analytical method? How good is measurement? How reproducible? - Precision How close to true value? - Accuracy How small a difference can be measured? - Sensitivity What range of amounts? - Dynamic Range How much interference? – Selectivity
CHARACTERISTICS OF AN ANALYTICAL METHODS Accuracy: The degree to which an experimental result approaches the true or accepted answer. Ways to Describe Accuracy: Error: An experimental measure of accuracy. The difference between the result obtained by a method and the true or accepted value. Absolute Error = (X – m) Relative Error (%) = 100(X – m)/m where: X = The experimental result m = The true result All Methods, except counting, contain errors – don’t know “true” value
CHARACTERISTICS OF AN ANALYTICAL METHODS Precision: The reproducibility of results. The degree to which an experimental result varies from one determination to the next. Illustrating the difference between “accuracy” and “precision” Low accuracy, high precision Low accuracy, low precision High accuracy, low precision High accuracy, high precision
CHARACTERISTICS OF AN ANALYTICAL METHODS Ways to Describe Precision: Range: the high to low values measured in a repeat series of experiments. Standard Deviation: describes the distribution of the measured results about the mean or average value. Absolute Standard Deviation (SD): Relative Standard Deviation (RSD) or Coefficient of Variation (CV): where: n = total number of measurements Xi = measurement made for the ith trial = mean result for the data sample
CHARACTERISTICS OF AN ANALYTICAL METHODS Response: The way in which the result or signal of a method varies with the amount of compound or property being measured. Ways to Describe Response: Calibration Curve: A plot of the result or signal vs. the known amount of a known compound or property (standard) being measured. Calibration expression is Absorbance = slope [Analyte (ppm)] + intercept
CHARACTERISTICS OF AN ANALYTICAL METHODS Parameters used to Describe a Calibration Curve: S = mc + Sbl S – measured signal c – analyte concentration Sbl – instrument signal for blank Sensitivity:calibration sensitivity = slope (m) of calibration curve. analytical sensitivity (g) = slope (m)/standard deviation (Ss) ability to discriminate between small differences in analyte concentration. Slope and reproducibility of the calibration curve. Method A Method B
Selectivity: degree to which the method is free from interference by other species the sample No method is totally free from interference from other species. Selectivity coefficient (k): kB,A = mB/mA Relative slopes of calibration curves indicate selectivity: S = mA(cA + kB,Acb) + Sbl Species A Species B Interested in detecting species A, but signal will be a combination of signal from the presence of species A and species B.
Calibration methods Basis of quantitative analysis is magnitude of measured property is proportional to concentration of analyte Detection Limit: The smallest [analyte] that can be determined with statistical confidence. analytical signal = 2 or 3 times std. dev. of blank measurement (approx. equal to the peak-peak noise level). Calculation of detection limit The minimum detectable analytical signal (Sm) is given by: Sm = Sbl + k(stdbl); for detection use k =3
Dynamic Range: linear region of calibration curvewhere the lower limit is ten times the standard deviation of the blank. LOQ - limit of quantitation LOL - limit of linearity Concentration (mM)
To Experimentally Determine • Perform 20 – 30 blank measurements over an extended period of time. • Treat the resulting data statistically to obtain Sbl (mean blank signal) and stdbl (std. dev. of blank signals). Use these to obtain Sm value. • Using slope (m) from calibration curve. Detection limit (Cm) is calculated by: (Rearranged from Sm = mc + Sbl)