Download
1 / 1
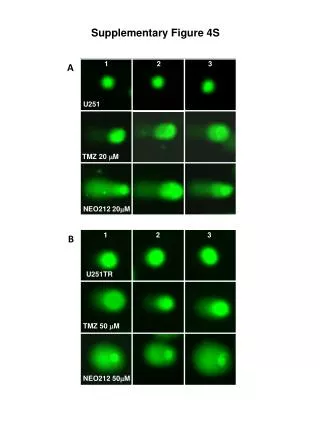
Effects of NEO212 on U251 and U251TR Cell Lines with Varying TMZ Concentrations
10 likes | 129 Vues
Supplementary Figure 4S.1.2.3 presents the impact of NEO212 on U251 and U251TR cell lines treated with different concentrations of temozolomide (TMZ). The U251 cells were exposed to 20 mM NEO212 alongside TMZ at 20 mM, while U251TR cells were treated with 50 mM NEO212 and 50 mM TMZ. This figure illustrates the cellular responses, highlighting differences between the two cell lines and their sensitivity to the treatments, contributing important insights into the efficacy of NEO212 as a potential therapeutic agent.
Télécharger la présentation 
Effects of NEO212 on U251 and U251TR Cell Lines with Varying TMZ Concentrations
An Image/Link below is provided (as is) to download presentation
Download Policy: Content on the Website is provided to you AS IS for your information and personal use and may not be sold / licensed / shared on other websites without getting consent from its author.
Content is provided to you AS IS for your information and personal use only.
Download presentation by click this link.
While downloading, if for some reason you are not able to download a presentation, the publisher may have deleted the file from their server.
During download, if you can't get a presentation, the file might be deleted by the publisher.
E N D
Presentation Transcript
Supplementary Figure 4S 1 2 3 A U251 TMZ 20 mM NEO212 20mM 1 2 3 B U251TR TMZ 50 mM NEO212 50mM


More Related