Download

1 / 1
10 likes | 124 Vues
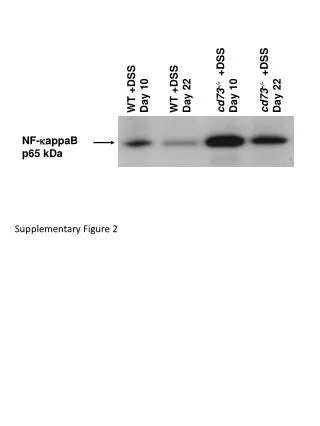
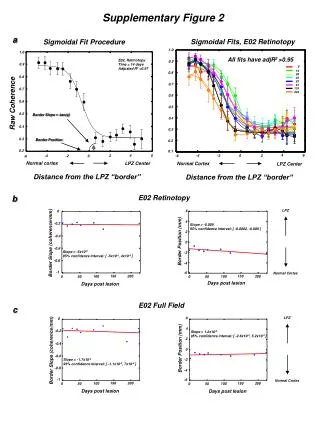
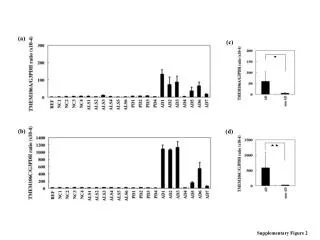
This study investigates LC3 and Actin in HCT116 cells and their impact on the Clonogenic and Cytotoxic assays using SN38 treatment. Additionally, SN38 IC50 values and LC3 labelling are analyzed to understand cellular response pathways.

E N D
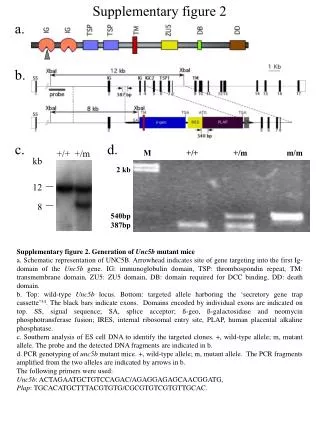
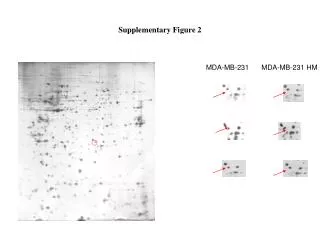
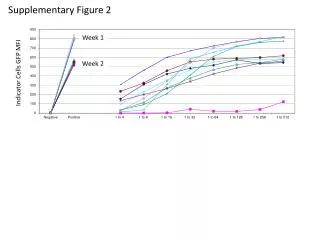
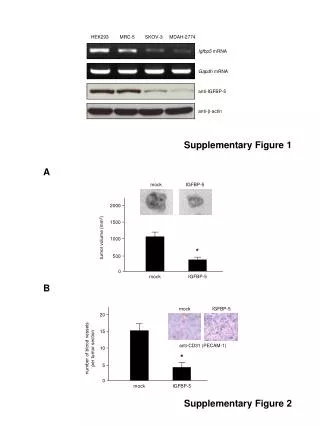
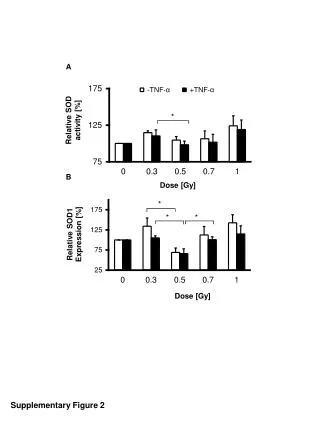
HCT116 HCT116 NT SN NT SN38 5 1.6 LC3 labelling 4 1.2 SN38 IC50 (nM) 3 0.8 LC3 spots/cell LC3 0.4 2 HCT116 Actin 0 1 Clonogenic assay SN38 siCT siATG5 siATG7 0 shLUC shMAPK14 HCT116 NT SN38 3 LC3 Cytotoxic assay 100 GAPDH 2 80 % living cells SN38 IC50 (nM) 60 1 40 20 0 0 siCT siAtg5 siAtg7 NT SN38 SN38+3MA HCT116 HCT116 Supplementary Figure 2 A B C D E F