
Uploaded by
garin
1 SLIDES
140 VUES
10LIKES
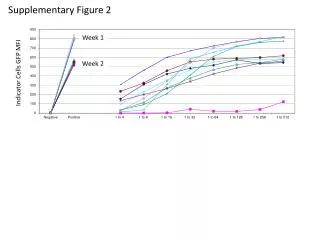
Analysis of GFP MFI in Indicator Cells Over Two Weeks
DESCRIPTION
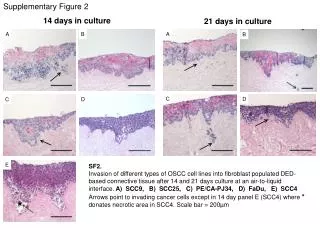
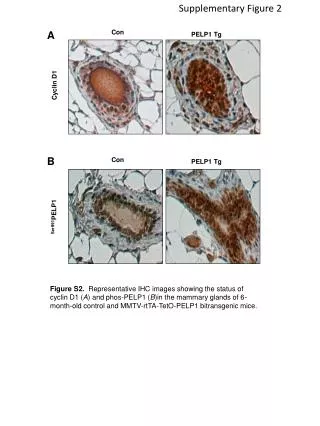
This supplementary figure illustrates the changes in GFP MFI (Mean Fluorescence Intensity) in indicator cells over a two-week period. Week 1 and Week 2 data provide insights into the cellular response and characteristics as they relate to the experimental conditions. The variations in fluorescence intensity are crucial for understanding the dynamics of the cells under study, enabling further analysis and interpretation of the results.
Download
1 / 1
Télécharger la présentation 
Analysis of GFP MFI in Indicator Cells Over Two Weeks
An Image/Link below is provided (as is) to download presentation
Download Policy: Content on the Website is provided to you AS IS for your information and personal use and may not be sold / licensed / shared on other websites without getting consent from its author.
Content is provided to you AS IS for your information and personal use only.
Download presentation by click this link.
While downloading, if for some reason you are not able to download a presentation, the publisher may have deleted the file from their server.
During download, if you can't get a presentation, the file might be deleted by the publisher.
E N D


More Related
Audio
Live Player