
Uploaded by
moriah
1 SLIDES
131 VUES
10LIKES
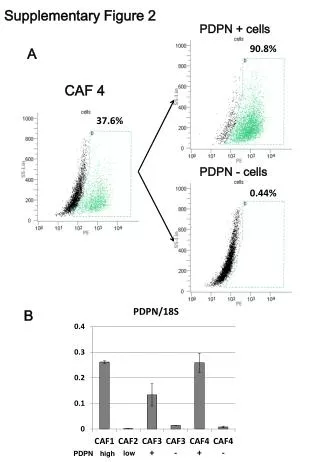
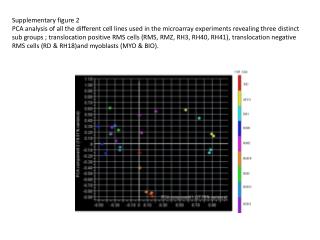
Impact of PDPN Expression Levels on Cellular Proportions in Tumor Microenvironment
DESCRIPTION
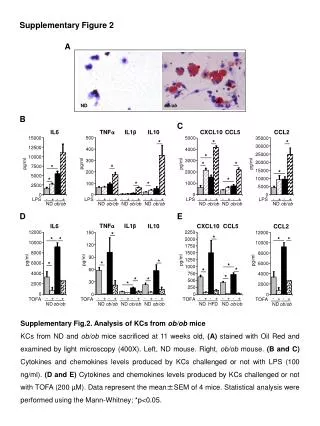
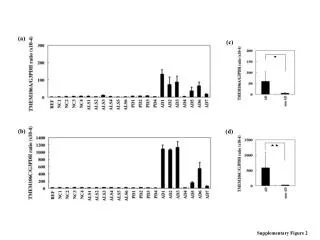
Supplementary Figure 2 illustrates the cellular distribution of PDPN-positive and PDPN-negative cells within the tumor microenvironment. The analysis shows that PDPN+ cells constitute 90.8% of the total population, while cancer-associated fibroblasts (CAFs) represent 4.37% with lower PDPN expression. In stark contrast, PDPN- cells make up only 0.44%. These findings highlight the significant role of PDPN in shaping cellular dynamics in tumors, emphasizing its potential as a marker for therapeutic targeting.
Download
1 / 1
Télécharger la présentation 
Impact of PDPN Expression Levels on Cellular Proportions in Tumor Microenvironment
An Image/Link below is provided (as is) to download presentation
Download Policy: Content on the Website is provided to you AS IS for your information and personal use and may not be sold / licensed / shared on other websites without getting consent from its author.
Content is provided to you AS IS for your information and personal use only.
Download presentation by click this link.
While downloading, if for some reason you are not able to download a presentation, the publisher may have deleted the file from their server.
During download, if you can't get a presentation, the file might be deleted by the publisher.
E N D
Presentation Transcript
Supplementary Figure 2 PDPN + cells A 90.8% CAF 4 37.6% PDPN - cells 0.44% low PDPN high B


More Related