Download

1 / 32
370 likes | 732 Vues
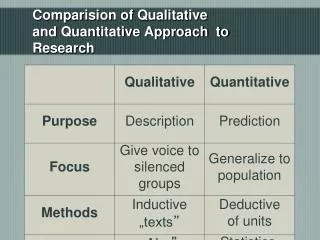
Introduction to quantitative and qualitative research. Dr Liz FitzGerald Institute of Educational Technology. Research and research methods. Research methods are split broadly into quantitative and qualitative methods Which you choose will depend on your research questions

E N D
Introduction to quantitative and qualitative research Dr Liz FitzGeraldInstitute of Educational Technology
Research and research methods • Research methods are split broadly into quantitative and qualitative methods • Which you choose will depend on • your research questions • your underlying philosophy of research • your preferences and skills
Basic principles of research design Four main features of research design, which are distinct, but closely related Ontology: How you, the researcher, view the world and the assumptions that you make about the nature of the world and of reality Epistemology: The assumptions that you make about the best way of investigating the world and about reality Methodology: The way that you group together your research techniques to make a coherent picture Methods and techniques: What you actually do in order to collect your data and carry out your investigations These principles will inform which methods you choose: you need to understand how they fit with your ‘bigger picture’ of the world, and how you choose to investigate it, to ensure that your work will be coherent and effective
Four main schools of ontology(how we construct reality) However, none of these positions are absolutes.They are on a continuum, with overlaps between them.
Epistemology i.e. the way in which you choose to investigate the world Two main schools are positivism and social constructionism: Positivistsbelieve that the best way to investigate the world is through objective methods, such as observations. Positivism fits within a realist ontology. Social constructionists believe that reality does not exist by itself. Instead, it is constructed and given meaning by people. Their focus is therefore on feelings, beliefs and thoughts, and how people communicate these. Social constructionism fits better with a relativist ontology.
Methodology * See also Adams, Anne; FitzGerald, Elizabeth and Priestnall, Gary (2013). Of catwalk technologies and boundary creatures. ACM Transactions on Computer-Human Interaction (TOCHI), 20(3), article no. 15. http://oro.open.ac.uk/35323/ Epistemology and ontology will have implications for your methodology Realists tend to have positivist approach tend to gather quantitative sources of data Relativists tend to have a social constructionist approach tend to gather qualitative sources of data Remember these are not absolutes! People tend to work on a continuum role for mixed methods and approaches Also consider the role of the researcher*: internal/external; involved or detached?
A note about data Quantitative data is about quantities, and therefore numbers Qualitative data is about the nature of the thing investigated, and tends to be words rather than numbers Difference between primary and secondary data sources Be aware of research data management practices and archives of data sets (both in terms of downloading and uploading)
Choosing your approach • Your approach may be influenced by your colleagues’ views, your organisation’s approach, your supervisor’s beliefs, and your own experience • There is no right or wrong answer to choosing your research methods • Whatever approach you choose for your research, you need to consider five questions: • What is the unit of analysis? For example, country, company or individual. • Are you relying on universal theory or local knowledge? i.e. will your results be generalisable, and produce universally applicable results, or are there local factors that will affect your results? • Will theory or data come first? Should you read the literature first, and then develop your theory, or will you gather your data and develop your theory from that? (N.B. this will likely be an iterative process) • Will your study be cross-sectional or longitudinal? Are you looking at one point in time, or changes over time? • Will you verify or falsify a theory? You cannot conclusively prove any theory; the best that you can do is find nothing that disproves it. It is therefore easier to formulate a theory that you can try to disprove, because you only need one ‘wrong’ answer to do so.
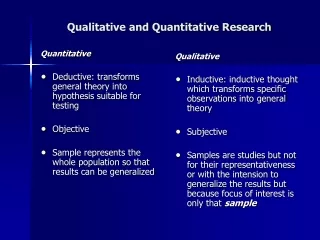
Quantitative approaches Attempts to explain phenomena by collecting and analysing numerical data Tells you if there is a “difference” but not necessarily why Data collected are always numericaland analysed using statistical methods Variables are controlled as much as possible (RCD as the gold standard) so we can eliminate interference and measure the effect of any change Randomisation to reduce subjective bias If there are no numbers involved, its not quantitative Some types of research lend themselves better to quant approaches than others
Quantitative data • Data sources include • Surveys where there are a large number of respondents (esp where you have used a Likert scale) • Observations (counts of numbers and/or coding data into numbers) • Secondary data (government data; SATs scores etc) • Analysis techniques include hypothesis testing, correlations and cluster analysis
Black swans and falsifiability • Falsifiability or refutability of a statement, hypothesis, or theory is the inherent possibility that it can be proven false • Karl Popper and the black swan; deductive c.f. inductive reasoning https://www.flickr.com/photos/lselibrary/IMAGELIBRARY/5 CC BY-SA 3.0, https://commons.wikimedia.org/w/index.php?curid=1243220 Hypothesis testing Start with null hypothesis i.e. H0 – that there will be no difference
Analysing quant data • Always good to group and/or visualise the data initially outliers/cleaning data • What average are you looking for? Mean, median or mode? • Spread of data: • skewness/distribution • range, variance and standard deviation
What are you looking for? Trying to find the signal from the noise Generally, either a difference (between/within groups) or a correlation Choosing the right test to use: parametric vs non-parametric (depends what sort of data you have – interval/ratio vs nominal/ordinal and how it is distributed) Correlation does not imply causation!
Example correlations From ‘Spurious correlations’ websitehttp://www.tylervigen.com/spurious-correlations
Interpreting test statistics Significance level – a fixed probability of wrongly rejecting the null hypothesis H0, if it is in fact true. Usually set to 0.05 (5%). p value - probability of getting a value of the test statistic as extreme as or more extreme than that observed by chance alone, if the null hypothesis H0, is true. Power – ability to detect a difference if there is one Effect size – numerical way of expressing the strength or magnitude of a reported relationship, be it causal or not
Example of quant data/analysis* * Case study taken from: Brown, Elizabeth (2007) The use of learning styles in adaptive hypermedia. PhD thesis, University of Nottingham. http://eprints.nottingham.ac.uk/10577/ Matched users were those who learning styles were matched with the lesson plan e.g. sequential users with a sequential lesson plan. Mismatched participants used a lesson plan that was not matched to their learning style, e.g. sequential users with a global lesson plan. H0 – there will be no statistically significant difference in knowledge gained between users from different experimental groups H1 – students who learn in a matched environment will learn significantly better than those who are in mismatched environment H2 – students who learn in a mismatched environment will learn significantly worse than those who learn in a matched environment
Interpreting test statistics Statistical testing was carried out using a univariate ANOVA in SPSS, to determine if there was any significant difference in knowledge gained. Initial conjecture suggests that the mismatched group actually performed better than the matched group. However, the difference between the two groups was not significant (F(1,80)=0.939, p=0.34, partial eta squared = 0.012) and hence hypotheses 1 and 2 can be rejected.
What quant researchers worry about Is my sample size big enough? Have I used the correct statistical test? have I reduced the likelihood of making Type I and/or Type II errors? Are my results generalisable? Are my results/methods/results reproducible? Am I measuring things the right way?
What’s wrong with quant research? Some things can’t be measured – or measured accurately Doesn’t tell you why Can be impersonal – no engagement with human behaviours or individuals Data can be static – snapshots of a point in time Can tell a version of the truth (or a lie?) “Lies, damned lies and statistics” – persuasive power of numbers
Qualitative approaches Any research that doesn’t involve numerical data Instead uses words, pictures, photos, videos, audio recordings. Field notes, generalities. Peoples’ own words. Tends to start with a broad question rather than a specific hypothesis Develop theory rather than start with one inductive rather than deductive
Gathering qual data • Tends to yield rich data to explore how and why things happened • Don’t need large sample sizes (in comparison to quantitative research) • Some issues may arise, such as • Respondents providing inaccurate or false information – or saying what they think the researcher wants to hear • Ethical issues may be more problematic as the researcher is usually closer to participants • Researcher objectivity may be more difficult to achieve
Sources of qual data Interviews (structured, semi-structured or unstructured) Focus groups Questionnaires or surveys Secondary data, including diaries, self-reporting, written accounts of past events/archive data and company reports; Direct observations – may also be recorded (video/audio) Ethnography
Analysing qual data Content analysis Grounded analysis Social network analysis (can also be quant) Discourse analysis Narrative analysis Conversation analysis
Example of qual data research* * Taken from: FitzGerald, Elizabeth; Taylor, Claire and Craven, Michael (2013). To the Castle! A comparison of two audio guides to enable public discovery of historical events. Personal and Ubiquitous Computing, 17(4) pp. 749–760. http://oro.open.ac.uk/35077/ Describing and comparing two types of audio guides: person-led and technology-led Geolocated audio to enable public, informal learning of historical events Data sources: questionnaires, researcher observations, and small focus groups
Data analysis and findings • Comparison of the two different walks • Differences/similarities of the walks • Issues surrounding participant engagement • Thematic analysis • Mode of delivery • Number of participants and social interactions • Geographical affordances of places and locations • User experience • Opportunities for learning • Other factors • Findings, lessons learned, recommendations
What qual researchers worry about Have I coded my data correctly? Have I managed to capture the situation in a realistic manner? Have I described the context in sufficient detail? Have I managed to see the world through the eyes of my participants? Is my approach flexible and able to change?
What’s wrong with qual research? It can be very subjective It can’t always be repeated It can’t always be generalisable It can’t always give you definite answers in the way that quantitative research can It can be easier to carry out (or hide) ‘bad’ (poor quality) qual research than ‘bad’ quant research
Other aspects of research design * See Lincoln, YS. & Guba, EG. (1985). Naturalistic Inquiry. Newbury Park, CA: Sage Publications. • Validity • Reliability • Trustworthiness* • Dependability: showing that the findings are consistent and could be repeated • Confirmability: a degree of neutrality or the extent to which the findings of a study are shaped by the respondents and not researcher bias, motivation, or interest • Credibility: confidence in the 'truth' of the findings • Transferability: showing that the findings have applicability in other contexts
Summary The type of approach you choose will be determined by your research question, your epistemological and ontological stances and your skills or ability to utilise a certain appoach For most people in ed tech, a mixed methods approach will be used So long as you make an informed choice and can justify it, it should be fine Just be aware of the limitations of your approach(es) and try to compensate where necessary
Acknowledgments and further links Some content borrowed from SkillsYouNeed website (http://www.skillsyouneed.com/learn/research-methods.html) Other useful links: Introduction to Quantitative and Qualitative Research Models (William Bardebes). PDF at http://tinyurl.com/qq-models Methods Map: http://www.methodsmap.org Ready To Research: http://readytoresearch.ac.uk Methods@Manchester: http://www.methods.manchester.ac.uk/resources/categories Research Data Management training: http://datalib.edina.ac.uk/mantra/
پایگاه پاورپوینت ایران www.txtzoom.com بانک اطلاعات هوشمند پاورپوینت پایگاه پاورپوینت ایران www.txtzoom.com بانک اطلاعات هوشمند پاورپوینت Click to edit Master subtitle style