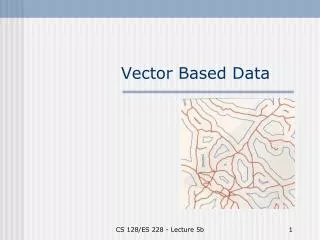
Vector-Based GIS Data Processing
Vector-Based GIS Data Processing. Chapter 6. Vector Data Model. Feature Classes points lines polygons Layers limited to one class of data Figure p. 186. Vector Data Model. Shapefiles ArcView non-topological most methods discussed in book will work in ArcView (the program compensates).

Vector-Based GIS Data Processing
E N D
Presentation Transcript
Vector-Based GIS Data Processing Chapter 6
Vector Data Model • Feature Classes • points • lines • polygons • Layers • limited to one class of data • Figure p. 186
Vector Data Model • Shapefiles • ArcView • non-topological • most methods discussed in book will work in ArcView (the program compensates)
Characteristics of Vector Processing • compares • layers • features within layers • layers with features in other layers • features with features in other layers • attributes • topological relationships • connectivity • adjacency • containment • note: must maintain topology when altering data
Data record • ground coordinates in double-precision • accuracy varies with data collection methods • errors may propagate
Data Processing Functions • Figure p. 188 (top) • input • analysis: figure p. 188 (bottom) • output
Vector Data Input: Phases • acquisition • digitizing • maps or remote-sensing data • table top or scan & vectorize • import existing data • field collection • editing • formatting/translating • linking
Digitizing Existing Maps • Digitizers • parts: table, cursor, controller • specifications • table size • resolution • accuracy: stability, repeatability, skew • process • figure p. 190
Digitizing Existing Maps • preparation • check source quality • obtain control points (tic points) • prepare specifications: fig p. 191 (top)
digitize template fig p. 191 (bottom) features common to all layer neat lines tic points common elements create only once save time ensure accurate overlay source base map input coordinates edit & build topology Digitizing Existing Maps
Digitizing Existing Maps • Digitize map • register map • one layer at a time • digitize all lines (spaghetti model) • stream mode vs point mode • mark lines as digitized • only lines appropriate for layer • post-digitizing data processing • assign IDs • editing: map must remain on digitizer until this step is complete
Scanning & Vectorization • “heads-up” digitizing • scanning: raster (or other) image • raster-vector conversion • processing
Scanning • scanner specifications • resolution • accuracy • scan size • output format • software quality • process • quick input • no layers (entire map is scanned)
Raster-Vector Conversion • automatic • must be started • must be watched • problems: broken lines, thin lines, contrast • manual (“heads-up”) • time-consuming • least editing (potentially)
Raster-Vector Conversion • text - automatic • symbol - manual • graphical editing
Importing Vector Data • outside source • metadata • translator • field survey (imports points) • direct • via table • CAD
Importing Vector Data • transformation • ground coordinates • projection • need metadata • need to understand what was used (and will be used) and why
errors (fig p. 195) intersection errors node errors polygons are closed polygon labeling topology process set environment build topology edit & correct join adjacent layers Graphical Data Editing
Graphical Data Editing • set editing environment • fig p. 196 • edit tolerance • weed tolerance • grain tolerance
Graphical Data Editing • topology building • build structure & relationships • fig p. 197 • identify errors & automatically correct • fuzzy & dangling tolerance [fig p. 198 (top)] • rebuild topology (& repeat) • data editing & error correction • fig p. 198 (bottom) • back up file before & during editing
Graphical Data Editing • join adjacent layers (if necessary) • fig p. 199 • edge match • join maps • dissolve redundant polygon boundaries • rebuild topology
Attribute Data Conversion • vector data, no attributes • steps to creating attribute table(s) • define structure of data file • populate data file • manual entry • add ID column to existing data table • check for errors • link to associated layers
Attribute Data Conversion • “event” themes (ArcView) • XY • uses XY coordinates in a table • creates a point theme • point, linear, continuous, address • uses existing shape file as reference • creates point or line theme
Vector-Based Data Analysis • attribute database query • analysis of attribute table data • selected items - fig p. 202 • retrieve associated graphical elements • may build new table • operations - fig p. 203 • select • project • join • ArcView: Query Builder
Vector-Based Data Analysis • statistical computation • mean, max, min, std. dev., quantile • ArcView • display within a theme • can summarize attributes of one theme based on polygons in another theme
Vector-Based Data Analysis • address geocoding - fig p. 204 • provides street addresses with XY coordinates • uses reference theme • projected line file of street network with address ranges • U.S. Census TIGER files • event table • contains street addresses • geocoding editor • both input files must be compatible with editor • parses event table addresses • compares addresses to reference data • creates new point file and table with XY coordinates
Vector-Based Data Analysis • calculation of areas, perimeters & distances • feature-based overlay analysis • point-in-polygon - fig p. 207 (upper left) • drops line downward from point • buffering (feature-based) - fig p. 207 (upper right) • point, line, polygon edge (inside or outside) • buffer zone is a polygon - fig p. 208 • neighborhood analysis • fixed or variable distance - fig p. 208
Vector-Based Data Analysis • reclassification (layer-based) • fig p. 209 • simplification • select attribute data • assign new, common value • merge appropriate adjacent polygons
Vector-Based Data Analysis • layer-based overlay analysis • features of two layers are intersected • point on polygon • line on polygon • polygon on polygon • creates new layer and attribute table - fig p. 210
Vector-Based Data Analysis • layer-based overlay analysis (con’t) • operators - fig p. 211 • union • intersect • identity • clip (cookie cutter) • erase cov • split
Vector-Based Data Analysis • layer-based overlay analysis (con’t) • define objectives & data analysis criteria • apply topological overlay operators - fig p. 212 & 213 • postoverlay processing & interpretation of results • removal of sliver polygons - fig p. 213 • use template • use tolerance or sliver criteria
Vector-Based Data Analysis • network analysis • interconnected, linear features • network layer - fig p. 214 • line segment/edge (has many attributes) • junction/intersection (point or node) • turn (attribute of junction)
Vector-Based Data Analysis • network analysis (con’t) • functions • pathfinding - fig p. 215 • allocation • tracing • spatial interaction (uses gravity modeling) • distance matrix • location-allocation modeling
Vector-Based Output Functions • presentation methods - fig p. 217 • map composition - Chapter 7 • vector-raster conversion • lose attributes
Vector Application Programming • “tool-box” approach • extensions • scripts • advantages • standardize processes • automate frequent functions • enhance capabilities
Vector Application Programming • internet map server • fig p. 223