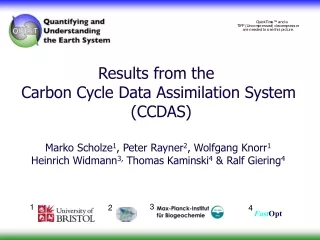
A prototype Carbon Cycle Data Assimilation System (CCDAS)
A prototype Carbon Cycle Data Assimilation System (CCDAS). Inferring interannual variations of vegetation-atmosphere CO 2 fluxes. Marko Scholze 1 , Peter Rayner 2 , Wolfgang Knorr #3 , Thomas Kaminski 4 , Ralf Giering 4. # presenting. 1. 2. 3. 4. Parameters: 58. Fluxes: 800,000.

A prototype Carbon Cycle Data Assimilation System (CCDAS)
E N D
Presentation Transcript
A prototype Carbon Cycle Data Assimilation System (CCDAS) Inferring interannual variations of vegetation-atmosphere CO2 fluxes Marko Scholze1, Peter Rayner2, Wolfgang Knorr#3, Thomas Kaminski4, Ralf Giering4 #presenting 1 2 3 4
Parameters: 58 Fluxes: 800,000 Station Conc. 10,000 Misfit to Observations Misfit 1 Carbon Cycle Data Assimilationusing automatic differentiation 1. Parameter Optimisation: Forward: Parameters –> Misfit Adjoint or Tangent linear: ∂ Misfit / ∂ Parameters 2. Parameter Uncertainties: Hessian: ∂2 Misfit / ∂ Parameters2 Error covariance=Inverse of Hessian 3. Uncertainty of Diagnostics: Adjoint or Tangent linear Biosphere Model: BETHY Atmospheric Transport Model: TM2
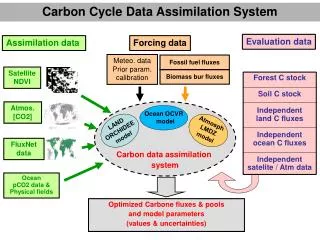
CCDAS Setup Assimilated Prescribed Assimilated CO2 + Uncert. Phenology Hydrology veg. index Satellite CCDAS Step 2 IMBETHY+TM2 only Photosynthesis, Energy&Carbon Balance CCDAS Step 1 full BETHY Background CO2 fluxes* Calibrated Params + Uncert. Diagnostics + Uncert. * * ocean: Takahashi et al. (1999), LeQuere et al. (2000); emissions: Marland et al. (2001), Andres et al. (1996); land use: Houghton et al. (1990)0
BETHY(Biosphere Energy-Transfer-Hydrology Scheme) lat, lon = 2 deg • GPP: C3 photosynthesis – Farquhar et al. (1980) C4 photosynthesis – Collatz et al. (1992) stomata – Knorr (1997) • Raut: maintenance respiration = f(Nleaf, T) – Farquhar, Ryan (1991) growth respiration ~ NPP – Ryan (1991) • Rhet: fast/slow pool resp. = wkQ10 T/10 C fast/slow / t fast/slow • slow –> infin. average NPP = b average Rhet (at each grid point) t=1h t=1h t=1day b<1: source b>1: sink
Parameters examples: relative error reduction:
El Niño events Pinatubo eruption La Niña global fluxes Processes 1 Carbon sink: GPP slightly exceeds respiration Carbon source anomaly: drop in GPP exceeds drop in resp Carbon sink anomaly: stronger decr. in resp. than GPP
correlation between Niño-3 SST anomaly and net CO2 flux shows maximum at 4 months lag, for both El Niño and La Niña states lag correlation (low-pass filtered) 4-month lagged: Pinatubo eruption: shows up as largest deviation in the low-pass filtered curve normalized CO2 flux and ENSO Processes 2 ENSO and terr. biosph. CO2: correlation seems strong
-0.8 -0.4 0 0.4 0.8 Processes 3 El Niño (>+1s) net CO2 flux to atm. gC / (m2 month) lagged correlation at 99% significance
Carbon Balance Euroflux (1-26) and other eddy covariance sites* net carbon flux 1980-2000 gC / (m2 year) *from Valentini et al. (2000) and others latitude N
Conclusions • CCDAS with 58 parameters can already fit 20 years of CO2 concentration data • Significant reduction of uncertainty for ~13 parameters, some important covariances • terr. biosphere response to climate fluctuations dominated by ENSO and Pinatubo • Can be explained by small perturbations of 3 large fluxes (GPP, Raut, Rhet)
Outlook • explore more parameter configurations • include fire as a process with uncertainties • include more constraints (isotopes, eddy fluxes) • extend approach to ocean carbon cycle