
Essential Guide to Data Preparation for Effective Mining
E N D
Presentation Transcript
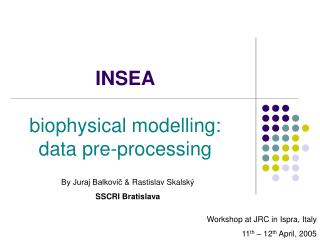
DataPreparation (Datapre-processing)
DataPreparation • Introduction to DataPreparation • Types of Data • Outliers • DataTransformation • MissingData 2
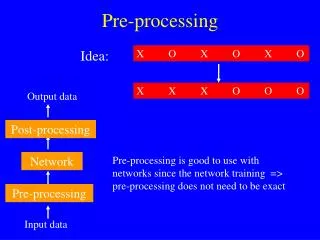
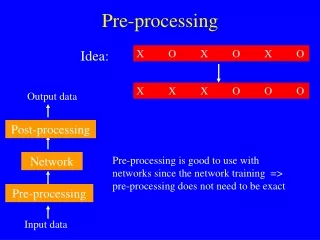
Why PrepareData? • Some data preparation is needed for all miningtools • The purpose of preparation is to transform datasets so that their information content is best exposed to the miningtool • Error prediction rate should be lower (or thesame) after the preparation as beforeit 4
Why PrepareData? • Preparing data also prepares the miner so thatwhen using prepared data the miner produces better models,faster • GIGO - good data is a prerequisite forproducing effective models of anytype 5
Why PrepareData? • Data need to be formatted for a given softwaretool • Data need to be made adequate for a givenmethod • Data in the real world is dirty • incomplete: lacking attribute values, lacking certain attributes of interest, or containing only aggregatedata • e.g.,occupation=“” • noisy: containing errors oroutliers • e.g., Salary=“-10”,Age=“222” • inconsistent: containing discrepancies in codes ornames • e.g., Age=“42”Birthday=“03/07/1997” • e.g., Was rating “1,2,3”, now rating “A, B,C” • e.g., discrepancy between duplicaterecords • e.g., Endereço: travessa da Igreja de Nevogilde Freguesia:Paranhos 6
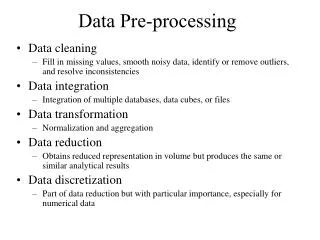
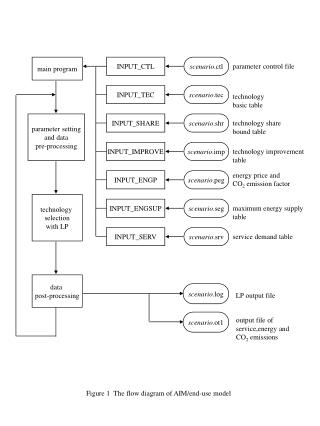
Major Tasks in DataPreparation • Data discretization • Part of data reduction but with particular importance, especially for numericaldata • Datacleaning • Fill in missing values, smooth noisy data, identify or remove outliers, and resolve inconsistencies • Data integration • Integration of multiple databases, data cubes, orfiles • Datatransformation • Normalization and aggregation • Data reduction • Obtains reduced representation in volume but produces the same or similar analytical results 7
Data Preparation as a step inthe Knowledge DiscoveryProcess Knowledge Evaluationand Presentation DataMining Selection and Transformation DW Cleaningand Integration DB 8
Types of Measurements • Nominalscale • Categorical scale • Ordinalscale • Intervalscale • Ratioscale More informationcontent Qualitative Quantitative Discrete or Continuous 10
Types of Measurements:Examples • Nominal: • ID numbers, Names of people • Categorical: • eye color, zipcodes • Ordinal: • rankings (e.g., taste of potato chips on a scale from 1-10), grades, height in {tall, medium,short} • Interval: • calendar dates, temperatures in Celsius or Fahrenheit, GRE (Graduate Record Examination) and IQ scores • Ratio: • temperature in Kelvin, length, time, counts 11
DataConversion • Some tools can deal with nominal values but other need fields to benumeric • Convert ordinal fields to numeric to be able to use “>” and “<“ comparisons on suchfields. • A 4.0 • A- 3.7 • B+ 3.3 • B 3.0 • Multi-valued, unordered attributes with small no.of values • e.g. Color=Red, Orange, Yellow, …,Violet • for each value v create a binary “flag” variable C_v , which is 1 if Color=v, 0 otherwise 20
Conversion: Nominal, ManyValues • Examples: • US State Code (50values) • Profession Code (7,000 values, but only fewfrequent) • Ignore ID-like fields whose values are unique for eachrecord • For other fields, group values“naturally”: • e.g. 50 US States 3 or 5regions • Profession – select most frequent ones, group therest • Create binary flag-fields for selectedvalues
Outliers • Outliers are values thought to be out ofrange. • “An outlier is an observation that deviates so much from other observations as to arouse suspicion that it was generated by a differentmechanism” • Can be detected by standardizing observations and label the standardized values outside a predetermined bound asoutliers • Outlier detection can be used for fraud detection or datacleaning • Approaches: • do nothing • enforce upper and lowerbounds • let binning handle theproblem
Outlierdetection • Univariate • Compute mean and std. deviation. For k=2 or 3, x is an outlier if outside limits (normal distributionassumed) • (xks,x ks)
Outlierdetection • Univariate • Boxplot: An observation is an extreme outlierif • (Q1-3IQR,Q3+3IQR), whereIQR=Q3-Q1 • (IQR = Inter QuartileRange) • and declared a mild outlier if it lies outside of theinterval • (Q1-1.5IQR,Q3+1.5IQR). http://www.physics.csbsju.edu/stats/box2.html 44
> 3L > 1.5L L
Outlierdetection • Multivariate • Clustering • Very small clusters areoutliers http://www.ibm.com/developerworks/data/li brary/techarticle/dm-0811wurst/
Outlierdetection • Multivariate • Distance based • An instance with very few neighbors within D is regarded as anoutlier Knnalgorithm
A bi-dimensional outlier that is not an outlier in either of itsprojections.
Recommendedreading Only with hard work and a favorable context you will have the chance to become anoutlier!!!
Normalization • For distance-based methods, normalization helps to prevent that attributes with large ranges out-weight attributes with small ranges • min-maxnormalization • z-scorenormalization • normalization by decimal scaling
Normalization • min-maxnormalization vminv v' (new_maxvnew_min) v new_minv maxvminv • z-scorenormalization v ' v v does not eliminateoutliers • v • normalization by decimalscaling Where j is the smallest integer such that Max(| v'|)<1 range: -986 to 917=>j=3 -986-> -0.986 917 ->0.917 v 10j v'
MissingData • Data is not alwaysavailable • E.g., many tuples have no recorded value for several attributes, such as customer income in salesdata • Missing data may be dueto • equipmentmalfunction • inconsistent with other recorded data and thusdeleted • data not entered due tomisunderstanding • certain data may not be considered important at the time ofentry • not register history or changes of thedata • Missing data may need to beinferred. • Missing values may carry some information content: e.g. a credit application may carry information by noting which field the applicant did notcomplete
MissingValues • There are always MVs in a realdataset • MVs may have an impact on modelling, in fact, they can destroyit! • Some tools ignore missing values, others use some metric to fill in replacements • The modeller should avoid default automated replacementtechniques • Difficult to know limitations, problems and introducedbias • Replacing missing values without elsewhere capturing that information removes information from thedataset
How to Handle MissingData? • Ignore records (use only cases with allvalues) • Usually done when class label is missing as most prediction methods do not handle missing data well • Not effective when the percentage of missing values per attribute varies considerably as it can lead to insufficient and/or biased sample sizes • Ignore attributes with missingvalues • Use only features (attributes) with all values (may leave out important features) • Fill in the missing valuemanually • tedious + infeasible?
How to Handle MissingData? • Use a global constant to fill in the missingvalue • e.g.,“unknown”. (May create a new class!) • Use the attribute mean to fill in the missingvalue • It will do the least harm to the mean of existingdata • If the mean is to be unbiased • What if the standard deviation is to beunbiased? • Use the attribute mean for all samples belonging to the same class to fill in the missingvalue
How to Handle MissingData? • Use the most probable value to fill in the missingvalue • Inference-based such as Bayesian formula or decisiontree • Identify relationships amongvariables • Linear regression, Multiple linear regression, Nonlinearregression • Nearest-Neighbourestimator • Finding the k neighbours nearest to the point and fill in the most frequent value or the averagevalue • Finding neighbours in a large dataset may beslow
How to Handle MissingData? • Note that, it is as important to avoid adding bias and distortion to the data as it is to make the informationavailable. • bias is added when a wrong value is filled-in • No matter what techniques you use to conquer the problem, it comes at a price. The more guessing you have to do, the further away from the real data the database becomes. Thus, in turn, it can affect the accuracy and validation of the miningresults.
Summary • Every real world data set needs some kind ofdata pre-processing • Deal with missingvalues • Correct erroneousvalues • Select relevantattributes • Adapt data set format to the software tool to beused • In general, data pre-processing consumes morethan 60% of a data mining projecteffort
References • ‘Data preparation for data mining’, Dorian Pyle,1999 • ‘Data Mining: Concepts and Techniques’, Jiawei Han and Micheline Kamber,2000 • ‘Data Mining: Practical Machine Learning Tools and Techniques with Java Implementations’, Ian H. Witten and Eibe Frank,1999 • ‘Data Mining: Practical Machine Learning Tools and Techniques second edition’, Ian H. Witten and Eibe Frank,2005 • DM: Introduction: Machine Learning and Data Mining, Gregory Piatetsky-Shapiro and GaryParker • (http://www.kdnuggets.com/data_mining_course/dm1-introduction-ml-data-mining.ppt) • ESMA 6835 Mineria de Datos(http://math.uprm.edu/~edgar/dm8.ppt)