Download
1 / 12
120 likes | 641 Vues
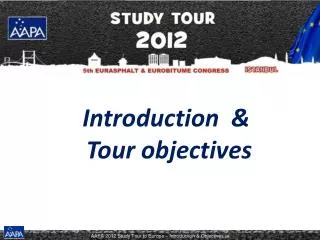
Introduction to the Study Tour objectives. Itinerary. 3 rd to 19 th September 2011 Tour group 9 Australian roads people Researchers / State & LG Road Officials / Consultants Industry representatives / Asphalt suppliers Wide range of experience

E N D
Introduction to theStudy Tour objectives
Itinerary • 3rd to 19th September 2011 • Tour group 9 Australian roads people • Researchers / State & LG Road Officials / Consultants • Industry representatives / Asphalt suppliers • Wide range of experience • Skilled including professional engineers & technologists • Five legs • Cape Town / Pretoria / Durban / CAPSA’11 / KNP • Four key issues
Key Issues • Surface Treatments • Sprayed seals | Slurry seals | Surface rejuvenation • Binders • use of bitumen rubber in sprayed seals and asphalt wearing courses, availability and specification requirements including quality control measure to ensure compliance. • Improving pavement performance • modelling, accelerated testing, design methods & models, foam bitumen stabilisation and bitumen treated base experience and transfer of high modulus asphalt technology to RSA • Sustainability • recycling, warm mix asphalt, efforts to reduce carbon footprint, carbon calculators and impacts for road asset management
Comparisons In Africa, man is still part of the food chain
ComparisonsLand area sq.kmSA: 1 219 912 A: 7 686 850 PopulationSA: est 49m A: est 21mRoads km totalSA: 362 099 A: 813 000 Surfaced kmSA: 73 506 A: 341 488Road AuthoritiesSA: 9 provinces + national A: 6 states, 2 territories + federal Road Budget Total (est)SA: U$ 275 million A: U$ 3500 million data ex CIA, AustRoads & Sabita ~ 2800 km ~ 1500 km ~ 1400 km ~ 3800 km
Road Train Load 166 tons (before overloading)98 wheels 53.5m long 650 hp on three driving axles
COMPARISONSSUMMARYBoth: Southern Hemisphere Different to Europe & North AmericaSimilar: traffic, climate, technology same suppliersDifferent: funding, socio-political dynamic“commercialised” agencies opportunities to innovate SAT, Educational Chair, RPF tyre pressure, user demands Potentials: higher education, sharing technology & experience Sport: rugby, cricket, professionalism