
The two-sample t -test
E N D
Presentation Transcript
The two-sample t-test Expanding t to two groups
t-tests used for population mean diffs • With 1-sample t, we have a single sample and a population value in mind • With 2-sample t, we have two groups. • Experimental vs. Control • Drug vs. placebo • Psychotherapy, wait list • New training, status quo • Brand Preference • Pepsi, Coke • Coors, Red Stripe • Male, Female • Husband, wife; Brother, sister; Sorority, fraternity • Use samples to decide about populations – treatment effectiveness, differences between brands, groups
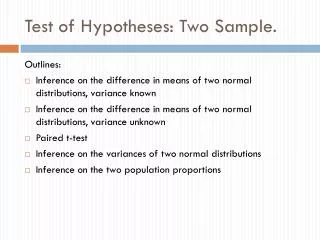
Varieties of t • 1-Sample (only one kind) • 2-Sample (two kinds) • Independent samples – groups are unrelated • Experimental vs. control groups (at random) • Male vs. female participants (unrelated) • Dependent samples – groups are related • Same person in both groups • Left hand vs. right hand • Pain-free vs. placebo • Groups are related somehow • Wife, husband • Cancer patient, friend
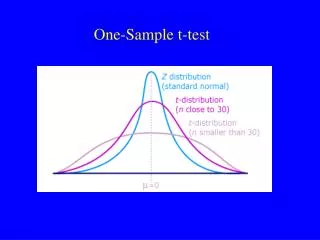
Common Structure of t test Many statistical tests have this form: Statistic/(Standard error of Statistic). All t-tests have this form. Example, 1-sample t: It may not look like it, but it is basically the difference in means divided by the standard error of the difference in means. The t-test and many other stats can be thought of as a fancy z score.
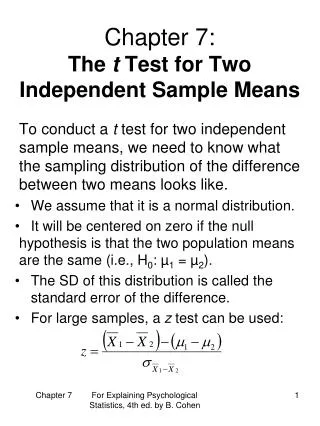
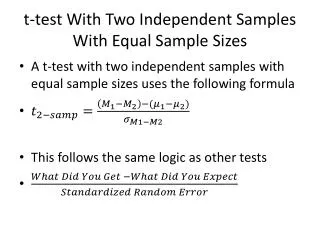
Independent Samples t The formula for the two-sample t-test for independent samples looks like this: This says we find the value of t by taking the difference in the two sample means and dividing by the standard error of the difference in means. The top part is just the means for the two groups. The bottom part is a function of the group standard deviations. Let us take a look.
Example of the Standard Error of the Difference in Means Suppose that at USF the mean height is 68 inches and the standard deviation of height is 6 inches. Suppose we sampled people 100 at a time into two groups. We would expect that the average mean difference would be zero. What would the standard deviation of the distribution of differences be? The standard error for each group mean is .6, for the difference in means, it is .85.
Estimating the Standard Error of Mean Differences The USF scenario we just worked was based on population information. That is: We generally don’t have population values. We usually estimate population values with sample data, thus: All this says is that we replace the population variance of error with the appropriate sample estimators.
Pooled Standard Error We can use this formula when the sample sizes for the two groups are equal. When the sample sizes are not equal across groups, we find the pooled standard error. The pooled standard error is a weighted average, where the weights are the groups’ degrees of freedom.
Example of the two-sample t, Empathy by College Major Suppose we have a professionally developed test of empathy. The test has people view film clips and guess what people in the clips are feeling. Scores come from comparing what people guess to what the people in the films said they felt at the time. We want to know whether Psychology majors have higher scores on average to this test than do Physics majors. No direction, we just want to know if there is a difference. So we find some (N=15) of each major and give each the test. Results look like this:
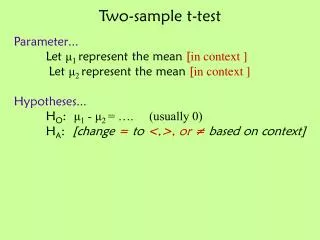
Six Steps 1. Set alpha. Set at .05. • State hypotheses: Null hypothesis Alternative (substantive) hypothesis 3. Calculate the statistic. 4. Determine the critical value. We are looking for a value of t in the table. N = 30, df = 30-2 = 28, alpha = .05, 2 tails. The critical value is 2.05.
Six Steps 5. State the decision rule. If the absolute value of the sample t is greater than or equal to critical t, then reject H0. If not, then fail to reject H0. In this case |.62| < 2.05, so we cannot reject H0. 6. State the conclusion. In our sample, t is not significant. Based on the results of this study, there is no evidence that Psychology majors and Physics majors differ on a test of empathy.