Download
1 / 7
70 likes | 83 Vues
Learn how to interpret and utilize achievement probabilities data to support student success and develop intervention plans based on TVAAS projections. Access individual student reports for detailed insights.

E N D
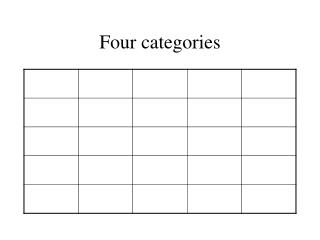
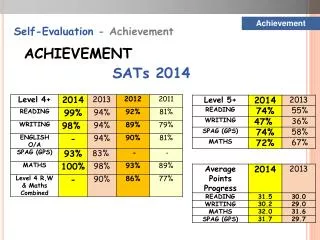
Press the right-arrow button to advance through this presentation How Do I Interpret and Use the Achievement Probabilities Data FAQ Student scores are confidential. Therefore the example below is merely a simulation model. None of the score data displayed below is real. TVAAS Slide 1 Source: TVAAS website as of July 2013 Website String: TVAAS website, Export, Data, Student Projections, Exported Files • Achievement Probability Data • Most tested subjects have four achievement categories • (Social Studies has three) • 1) Advanced • 2) Proficient • 3) Basic • 4) Below Basic Most TVAAS Projections reports includes probabilities about these achievement levels
How Do I Interpret and Use the Achievement Probabilities Data FAQ TVAAS Slide 2 Achievement Probability Data 1) Advanced 2) Proficient 3) Basic This student only has a 0.7% probability of earning a score at the advanced level
How Do I Interpret and Use the Achievement Probabilities Data FAQ TVAAS Slide 3 Achievement Probability Data 1) Advanced 2) Proficient 3) Basic This student has a 41.4% probability of earning a score at the proficient level
How Do I Interpret and Use the Achievement Probabilities Data FAQ TVAAS Slide 4 Achievement Probability Data 1) Advanced 2) Proficient 3) Basic This student has a 92.3% probability of earning a score at the basic level
How Do I Interpret and Use the Achievement Probabilities Data FAQ TVAAS Slide 5 Achievement Probability Data 1) Advanced: 0.7% probability 2) Proficient: 41.4% probability 3) Basic: 92.3% probability • So what do you do with this information? • Since our common goal is for all students to be proficient or advanced, use these probabilities to develop intervention plans for those students with high probabilities of being at or below the basic level • Also develop intervention plans to help move students from the proficient to the advanced level
Source: TVAAS website as of August 2013 Website String: 1) Log in to theTVAAS website, 2) Select the Reports tab 3) Future Academic Performance, 4) School (Single Grade) Future Academic Performance, 5) select the grade level, 6) select the test and subject, 7) select either advance, accelerate II, or accelerate I, 8) select a student's name, 9) select the subject, 10) select student reports, 11) select student projection reports Student scores are confidential. Therefore the example below is merely a simulation model. None of the score data displayed below is real. FAQ How Do I Interpret and Use the Achievement Probabilities Data TVAAS Slide 6 You Can Also View TVAAS Student Probabilities Via Individual Student Reports Report: Student Projection Report Student: John Doe 02 Projection: 8th TCAP Science 99 Expressed in State %-tiles 90 Projection: 8th TCAP Science 80 Projected State Percentile Probability of Success 70 Basic Proficient Advanced 60 81 99.9% 99.2% 55.1% 50 40 30 20 10 01 TCAP (Sci) 2011 (6) TCAP 2009 (4) TCAP 2010 (5) TCAP 2012 (7) TCAP 2008 (3) TCAP
FAQ TVAAS How Do I Interpret and Use the Projected Scores Spreadsheet from the TVAAS Website? Slide 7 • Reference Sources about TVAAS Score Projections and/or Probabilities • For more details about EVAAS/TVAAS projection methodology, read the following two documents • (1) "What Should Teachers Know About TVAAS Student Probabilities?" • -(2011 SAS Policy Brief byCathy Brinsfield ) • -access it via the TVAAS log on webpage under "Training and Development" • Link: TVAAS Log On Webpage • (2) "Measurement of Academic Growth of Individual Students toward Variable and Meaningful Academic Standards " • -(2006 SAS White Paper by Wright, Sanders, and Rivers ) • Link: SAS White Paper about score projections