OAKS Practice Test
Developed by Mr. Ross.

OAKS Practice Test
E N D
Presentation Transcript
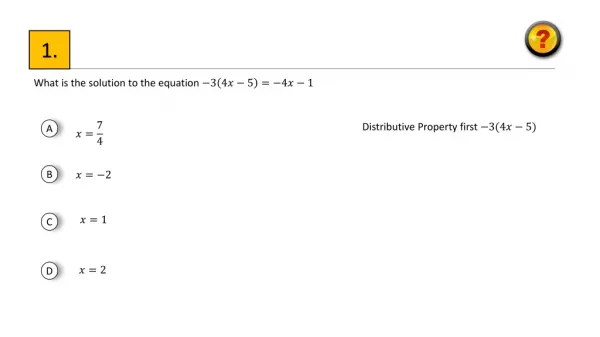
1. What is the solution to the equation Distributive Property first A B C D
2. What is the distance of A B C D
3. Which of the graphs below represents a proportional relationship/direct variation graph? A D B C
3. In the right trapezoid QRST, what is the measure of given ? A B C D
4. What is the slope-intercept equation of the line that goes through the points (3, 5) and (−1, 13)? If you are stuck, use a graph! A B C D
5. What is the perimeter of isoceles? feet A feet B ft. ft. feet C feet D
6. What is the solution to: This would be a good system to graph. A C D B
7. Bob, Dana, Eric, and Jessica recorded the number of free throws they made at practice throughout the week. After five days, which player had the highest meanscore of free throws made.? A Bob B Dana C Eric D Jessica
8. Which linear equation passes through and ? A B C D
9. From home, you ride your bike 8 miles east and then turn 90 south, riding another 4 miles to school. What is the direct distance from the school to your house? miles A B miles miles C miles D
10. In the diagram below, <3 and <4 represent which type of angle pair relationship? Alternate Exterior Angles A B Alternate Interior Angles C Corresponding Angles D Same Side Interior Angles
11. What is the value of ? A B C D
12. Which box-and-whisker plot represents this data set? 8, 13, 13, 14, 16, 19, 23, 27, 30 C A B D
13. What is the equation of the line graphed to the right? A B C D
14. Find the measure of angle , given line a is parallel with line m. A B C D
15. What is the value of ? A B C D
16. Laurie has $40 in the cash register and makes $5 every hour at the Farmer’s Market. Which graph represents her profits over time? D C B A
17. Which of the data tables models a quadratic relationship? A B C D
18. According to the box and whisker plots below, which city has the greatest range of temperatures? Temperature in Seattle A B San Antonio C New York Range can’t be determined from the graphs. D
19. A 55 foot wire placed at the top of a is anchored 14 feet from the base of a tree. What is the estimated height of the tree? feet A B feet feet C feet feet D feet
20. Which system of equations has no solution? A B C D
21. Solve for given line is parallel to line . A f B C e D
22. Antonio’s aircraft is 5,200 feet in the air when it descends 250 feet per minute toward the landing pad. Which equation models the total height() of Antonio’s plane after minutes? A B C D
23. Bobby bought five pairs of socks at the store. They cost $4.50, $7.50, $4.50, $4, $7. What was the mean price of the socks? A $4.50 $5.50 B C $5.00 D $27.50
24. Caleb collected data on the heights of students in her preschool class and their weights. What type of correlationwould you expect the data to have? A Even correlation B No correlation C Positive correlation Negative correlation D
25. What is the approximate diameter of the wagon wheel if ? A ft B ft C ft D ft
26. What is the value of ? A B C D
27. What are the missing numbers in the data set? Assume the numbers are in increasing order. A 22, 36 B 36, 44 C 36, 49 D 36, 50
28. The bar graph shows the types of cars driven by randomly selected drivers. Approximately how many people drive SUV’s? A B C D
29. The pie chart shows the percent of sales by category at the concession stand of the movie theater. One night the concession stand had $180 in popcorn sales. About how much would you expect the total concession stand sales for the evening would have been? A Set up a proportion B C D
30. The stem-and-leaf plot shows some of the scores of students on the latest test. What was the median score for this test? A 72% B 90.5% 89% C 80% D
31. Barry works at a bottled water company where he must check the number of ounces put into each bottle. A group of bottles comes through with the following weights in ounces. 18.9, 19.9, 20, 20.2, 20.2, 20.3 If Barry ignores the bottles with the minimum and maximum number of ounces, how will that affect the mean and median? A The mean will increase but the median will remain the same. C The mean and median will both decrease. B D The mean and median will both increase. The mean will decrease but the median will remain the same.
32. Michael’s goal is to type an average of 55 words per minute on his five typing exams. His scores on the first four exams were 49, 58, 52, and 56 words per minute. How many words per minute will he need on his fifth exam to reach his goal? A 62 B 59 60 C 55 D
33. What is the measure of AWE if and ? E A B A B W C D