MODEL BUILDING IN REGRESSION MODELS
This guide explores model building in regression analysis, particularly addressing the challenges of multicollinearity. It discusses the selection of variables through techniques such as stepwise regression, where variables are added one at a time based on their significance. Different approaches, like performing individual and combination tests on variables, are reviewed to identify the most effective predictors for the model. Examples illustrate how to evaluate p-values and the Modified F-test for determining the importance of variable subsets in regression models.

MODEL BUILDING IN REGRESSION MODELS
E N D
Presentation Transcript
MODEL BUILDING IN REGRESSION MODELS
Model Building and Multicollinearity • Suppose we have five factors that we feel could linearly affect y. If all 5 are included we have: y = 0 + 1 x1 + 2 x2 + 3 x3 + 4 x4 + 5 x5 + • But while the p-value for the F-test (Significance F) might be small, one or more (if not all) of the p-values for the individual t-tests may be large. • Question: Which factors make up the “best” model? • This is called model building
Model Building • There many approaches to model building • Elimination of some (all) of the variables with high p-values is one approach • Forward stepwise regression “builds” the model by adding one variable at a time. • Modified F-tests can be used to test if the a certain subset of the variables should be included in the model.
Suppose this model has lowest p-value (< α) The Stepwise Regression Approach • y = 0 + 1 x1 + 2 x2 + 3 x3 + 4 x4 + 5 x5 + • Step 1: Run five simple linear regressions: • y = 0 + 1 x1 • y = 0 + 2 x2 • y = 0 + 3 x3 • y = 0 + 4 x4 • y = 0 + 5 x5 • Check the p-values for each – • Note for simple linear regression Significance F = p-value for the t-test.
Suppose lowest p-values (< α) Add X3 Stepwise Regression • Step 2: Run four 2-variable linear regressions: Check Significance F and p-values for: • y = 0 + 4 x4 + 1 x1 • y = 0 + 4 x4 + 2 x2 • y = 0 + 4 x4 + 3 x3 • y = 0 + 4 x4 + 5 x5
Stepwise Regression • Step 3: Run three 3-variable linear regressions: • y = 0 + 3 x3 + 4 x4 + 1 x1 • y = 0 + 3 x3 + 4 x4 + 2 x2 • y = 0 + 3 x3 + 4 x4 + 5 x5 • Suppose none of these models have all p-values < α -- STOP -- best model is the one with x3 and x4 only
Performing Tests With More Than One Variable • Remember the Range for X must be contiguous • Use CUT and INSERT CUT CELLSto arrange the X columns so that they are next to each other
Best Model • The best model is the three-variable model that includes x1, x4, and x5.
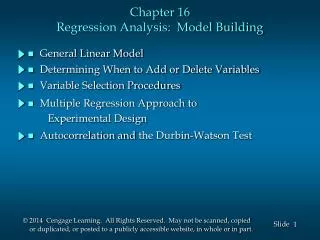
TESTING PARTS OF THE MODEL • Sometimes we wish to see whether to keep a set of variables “as a group” or eliminate them from the model. • Example: Model might include 3 dummy variables to account for how the independent variable is affected by a particular season (or quarter) of the year. • Will either keep all seasons or will keep none • The general approach is to assess how much “extra value” these additional variables will add to the model. • Approach is a Modified F-test
Approach: Compare Two Models –The Full Model and The Reduced Model • Suppose a model consists of p variables and we wish to consider whether or not to keep a set of p-q of those p variables in the model. • Two models • Full model – p variables • Reduced model – q variables • For notational convenience, assume the last p-q of the p variables are the ones that would be eliminated. • Sample of size n is taken
# variables considered for elimination Degrees of Freedom for the Error Term of the Full Model The Modified F-Test • Modified F-Test: H0: βq+1 = βq+2 = ..… = βp = 0 HA: At least one of these p-q β’s ≠ 0 • This is an F-test of the form: Reject H0 (Accept HA) if: F > Fα,p-q,n-p-1
The Modified F-Statistic • For this model, the F-statistic is defined by:
Example • A housing price model (Full model) is proposed for homes in Laguna Hills that takes into account p = 5 factors: • House size, Lot Size, Age, Whether or not there is a pool, # Bedrooms • A reduced model that takes into account only the first of these (q = 3) was discussed earlier. • Based on a sample of n = 38 sales, can we conclude that adding these p-q = 2 additional variables (Pool, # Bedrooms) is significant?
The Modified F-Test For This Example • Modified F-Test: H0: β4 = β5 = 0 HA: At least one of β4 and β5 ≠ 0 For α = .05, the test is Reject H0 (Accept HA) if: F > F.05,2,32 F.05,2,32 can be generated in Excel by FINV(.05,2,32) = 3.29.
SSEFull DFEFull MSEFull Full Model
SSEReduced Reduced Model
SSE from Output Reduced Worksheet =((G3-C13)/2)/D13 =FINV(.05,2,B13) The Partial F-Test
The Modified F-Statistic • For this model, the modified F-statistic is: • The critical value of F = F.05,2,32 = 3.29453087 • 21.43522834 > 3.29453087 There is enough evidence to conclude that including Pool and Bedrooms is significant.
Review • Stepwise regression helps determine a “best model” from a series of possible independent variables (x’s) • Approach – • Step 1 – Run one variable regressions • If there is a p-value < , keep the variable with lowest p-value as a variable in the model • Step 2 – Run 2-variable regressions • One of the two variables in each model is the one determined in Step 1 • Keep the one with the lowest p-values if both are < • Repeat with 3, 4, 5 variables, etc. until no model as has p-values < • Modified F-test for testing the significance of parts of the model • Compare F to Fα,p-q,DFE(Full), where F= ((SSEReduced – SSEFull)/(#terms removed))/MSEFull