MODEL BUILDING THROUGH REGRESSION
MODEL BUILDING THROUGH REGRESSION. contents. Introduction to model building through regression Linear regression model. Maximum a posteriori ( MAP) estimation of parameter vector. Relation between regularized least-squares estimation and MAP estimation.

MODEL BUILDING THROUGH REGRESSION
E N D
Presentation Transcript
contents • Introduction to model building through regression • Linear regression model. • Maximum a posteriori (MAP) estimation of parameter vector. • Relation between regularized least-squares estimation and MAP estimation. • Computer experiment: pattern classification. • The Minimum-Description-Length principle. • Finite sample-size consideration. • The instrumental –variables method.
Introduction to model building through regression If there are a set of random variable and want to find the relation between them we find that The regression model form • One of the random variable is a dependent (response). • The remaining random variable are called independent (regressors) . • The dependence of response on the regressors includes an additive error term (expectational error).
The regression model types There are two classes of regression models: • Linear regression(tractable) In linear regression ,the dependence of the response on the regressors is defined by a linear function. • Nonlinear regression (difficult in their analysis) Nonlinear regression models , this dependence is defined by a nonlinear function.
To get mathematical tractability of linear regression model we use two ways: • Bayesian theory • least squares method.
Linear regression model(mathematical framework) Consider a unknown stochastic environment (regular environment), we applying a set of input( regressors), and Output of environment denoted by d (response) Linear regression model parameterized as: as
with the environment being stochastic, it follow that x,d & error are sample values of random vector X, D,E
Now we can formulate from previous equation that Now we can say that: Given the joint statistics of the regressorX and the corresponding response D , estimate the unknown parameter vector W. When we speak of the joint statistic , we mean the following set of statistical parameter • Correlation matrix of the regressorX • The variance of the desired response D • The cross-correlation vector of the regressorX and the desired response D.
Maximum a posteriori estimation of parameter vector( Bayesian theory) there are two remark are in this model • the regressorx acts as the “excitation", bearing no relation whatsoever to the parameter vector w. • information about the unknown parameter vector w is contained solely in the desired response D that acts as the “observable” of the environment. So we are focus the joint probability density function of W and d , conditional onX
let density function is and it has the equivalent form so It is a special form of Bayesian theory
Bayes’s theorem has four density function • Observation density(p(d|w,x)). • Prior (p(w)) . • Posterior density (p(w|d, x)) . • Evidence(p(d)) . The observation density (p(d|w,x)) is commonly reformulated as likelihood function
The posterior density of vector Wparameterizing the regression model is proportional to the product of likelihood function and the prior To provides the basis for the maximum- likelihood(ML)estimate of the parameter vector w, as shown by The maximum a posteriori (MAP) estimate of the parameter vector w by the formula
MAP estimator is more profound than the ML for two reasons :- • The MAP depend on the observation and prior information in contrast the ML estimator depend on the observation density function. • The ML estimator relies to a nonunique solution but MAP estimator enforce uniqueness and stability on solution.
The posterior density of vector wparameterizing the regression model is proportional to the product of likelihood function and the prior To provides the basis for the maximum- likelihood(ML)estimate of the parameter vector w, as shown by The maximum a posteriori (MAP) estimate of the parameter vector w by the formula
Parameter estimation in a Gaussian environment • Assume that we have training sample to environment expressed as:- Where number of times to repeat experiment regressor on ith trial response on ith trial
To proceed with the task of parameter estimation, we make the following assumption: • Assumption 1: statistical independence and identical distribution (iid) . • Assumption 2 : Gaussianity The environment , responsible for generation training sample, is Gaussian distribution. • Assumption 3 : Stationary the parameter vector W fixed .
The parameter estimation theory under Gaussian environment As we want to estimate the parameter vector W we need to found the expectation error ,prior & likelihood; under the previous assumptions Expectation error prior likelihood
As so So the maximum a posteriori estimation under Gaussian environment is: where (1)
Right hand side of Eq.(1) is quadratic function we defined it as : If we differentiating this function with respect to “w” we get the model Where
To get we suppose is too large so: Previous equation is normal equation that prove estimator is unbiased estimator After N time of experiment
Relation between regularized least-squares estimation and MAP estimation. We will focus now on a cost function defined as the squared expectational errors summed over the N where regression model due to vector w as i=1,2,…,N so (1)
We minimizing this cost function with respect to time that identical to maximum likelihood estimator • To overcome all the problem, the customary practice is to expand the cost function of Eq.(1) by adding new term as follow: = This particular solution is referred to as a regularized least square (RLS)solution.
Computer experiment : pattern classification By comparing this two figures we found that the decision boundaries in two algorithm are both linear but there are some different:
1.3 THE PERCEPTRON CONVERGENCE THEOREM The algorithm for adapting the weight vector If there are nth member of x(n), is correctly classified by the weight vector w(n) , no correction is made to the weight vector of the perceptron in accordance with the rule: If there a correction η(n) learning rate.
The minimum- Description -length principle The representation of stochastic process by a linear model may be used for • synthesis (model generation) • Analysis(estimate the parameter of model)
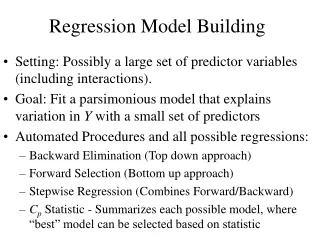
To select model we use minimum description length(MDL) • The MDL principle to traced back to kolmogrove complexity theory that defined as : • By using kolmogrove complexity we may develop a theory of "idealized inductive inference” the goal of which to defined • Regularity (Ability to compress model) it is algorithm that concerned with the shortest length of binary computer that print out a data sequence then halt.
MDL method Suppose we are give a candidate model or model class “M” and we have point hypothesis “P” as The MDL tell us to look for hypothesis that compress the data sequence d at most Where length of “P” length of data sequence “d” when it encoded with the help of “P”
Model order selection(two part code MDL) Let denote a family of linear regression model associated with the parameter vector If applied a training sample and we want to select from the model that we applied that samples on it we use the mathematical equation of the minimum description line method.
the mathematical equation of the minimum description line method Error term related to the model and data Complexity related to the model alone Error term Complexity term The O(k) term is ignored to simplify matter as it can be explicitly and efficiency
Attributes of the MDL principle • Accept the simplest explanation that fits the data • Consistent model selection estimator in the sense that it convergence to the true model order as sample size
Finite sample-size consideration(over fitting problem) Consider the generic regressive model is : where f(x,y) deterministic function of x for some w This method depicted in fig(a) its purpose is to explain or predict the response d product by the regressorx (a) Mathematical model of a stochastic environment, parameterized by the vector w
Fig(b) is the physical model of the environment its purpose is to encode empirical knowledge represented by the training sample From this figure we can write
We known that the estimator is the minimize of cost function
The natural measure of the effectiveness of f(x, ) as a predictor of the desired response d defined as follow
Bias variance dilemma as V( ) V( ) B( ) B( ) We know make two important observation: Is the bias of the average value of the approximating function measured with respect to the regression function The second term is the variance of the approximating function
The instrumental –variables method If there are regressorx observed only in the presence of additive error the noisy regressor is now defined by Where The parameter estimation to likelihood is Noise associated with The time average correlation function of the noisy regressorz Corresponding time averaged cross correlation function between d & z
Assuming the measurement noise vector v is white noise with zero mean and correlation matrix and so
The instrumental –variables method Suppose a set of instrumental variable that has the same dimensional as the noise regressor and satisfies the following two properties: Property 1:instrumental is highly correlated with the noiseless regressor Property 2:The instrumental and the measurement noise vector V are statistically independent For all j and k For all j and k
we equipped with the instrumental vector satisfies the previous properties, so we compute the following correlation function When we apply the method of instrumental variables the key issue is how to obtain or generate variable satisfy the two probability