Regression Model Building
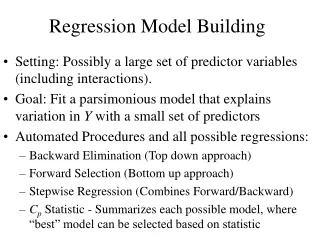
This project involves developing a regression model to predict the crew size of 157 cruise ships based on various predictor variables including ship age, tonnage, passenger capacity, length, cabins, and passenger density. Using techniques such as backward elimination and forward selection, we streamline model parameters while minimizing the AIC. The model quality is validated through cross-validation methods, including K-fold and hold-out samples, ensuring robust estimates that reflect real-world scenarios in the cruise industry. Key predictors retained are tonnage, passengers, length, and cabins.

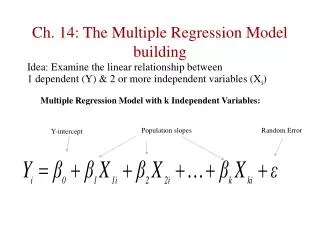
Regression Model Building
E N D
Presentation Transcript
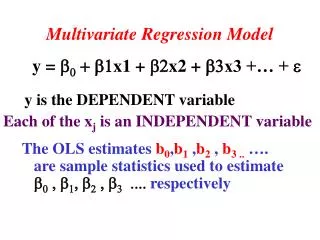
Regression Model Building Predicting Number of Crew Members of Cruise Ships
Data Description • n=157 Cruise Ships • Dependent Variable – Crew Size (100s) • Potential Predictor Variables • Age (2013 – Year Built) • Tonnage (1000s of Tons) • Passengers (100s) • Length (100s of feet) • Cabins (100s) • Passenger Density (Passengers/Space)
Summary of Automated Models • Backward Elimination • Drop Passenger Density (AIC drops from 1.055 to -0.943) • Drop Age (AIC drops from -0.943 to -2.062) • Stop: Keep Tonnage, Passengers, Length, Cabins • Forward Selection • Add Cabins (AIC drops from 397.18 to 28.82) • Add Length (AIC drops from 28.82 to 9.8661) • Add Passengers (AIC drops from 9.8661 to -0.0565) • Add Tonnage (AIC drops from -0.0565 to -2.06) • Stop: Keep Tonnage, Passengers, Length, Cabins • Stepwise – Same as Forward Selection
All Possible (Subset) Regressions (Best 4 per Grp) BIC Adj-R2 Cp
Cross-Validation • Hold-out Sample (Training Sample = 100, Validation = 58) • Fit Model on Training Sample, and obtain Regression Estimates • Apply Regression Estimates from Training Sample to Validation Sample X levels for Predicted MSEP = sum(obs-pred)2/n • Fit Model on Validation Sample and Compare regression coefficients with model for Training Sample • PRESS Statistic (Delete observations 1-at-a-time) • Fit model with each observation deleted 1-at-a-time • Obtain Residual for each observation when it was deleted • PRESS = sum(obs-pred(deleted))2 • K-fold Cross-validation • Extension of PRESS to where K groups of cases are deleted • Useful for computationally intensive models (not OLS)
Hold-Out Sample – nin = 100 nout = 58 Coefficients keep signs, but significance levels change a lot. See Tonnage and Length.
PRESS Statistic Model appears to be valid, very little difference between PRESS/n and MS(Resid)