Comparative Analysis of Hotspot and Cluster Detection Methods in Spatial Statistics
This document explores two primary methods for hotspot and cluster detection: Spatial Scan Statistics and DBSCAN. The Spatial Scan Statistics method employs a continuous Poisson model to test hypotheses regarding the distribution of points, comparing a likelihood ratio derived from clustered versus random distributions. DBSCAN, a density-based clustering algorithm, operates on parameters like radius and minimum neighbors to identify clusters while labeling outliers. Results from both methods highlight significant findings, with comparisons made on the effectiveness of identifying clusters under different conditions.

Comparative Analysis of Hotspot and Cluster Detection Methods in Spatial Statistics
E N D
Presentation Transcript
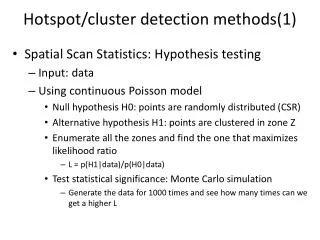
Hotspot/cluster detection methods(1) • Spatial Scan Statistics: Hypothesis testing • Input: data • Using continuous Poisson model • Null hypothesis H0: points are randomly distributed (CSR) • Alternative hypothesis H1: points are clustered in zone Z • Enumerate all the zones and find the one that maximizes likelihood ratio • L = p(H1|data)/p(H0|data) • Test statistical significance: Monte Carlo simulation • Generate the data for 1000 times and see how many times can we get a higher L
Hotspot/cluster detection methods(2) • DBSCAN: Density-based spatial clustering of application with noise • Input: data, radius, min_neighbors • For each data point P: • If neighbors<min_neighborsthen mark P as noise • eles • Add P to a new cluster C • Expand P by looking at points P’ in the current neighborhood of C • If P’ is not in any cluster then add P’ to C • If neighbors of P’> min_neighbors then add P’s neighbor to C’s neighborhood
SatScan Result 1 clusters found But insignificant
DBSCAN results: CSR 2 clusters found
DBSCAN results: CSR 6 clusters found
DBSCAN results: CSR 7 clusters found
DBSCAN result 5 clusters found
DBSCAN result 3 clusters found
DBSCAN result 6 clusters found
DBSCAN result 6 clusters found