Download

1 / 33
330 likes | 470 Vues
Factors Influencing Response Rates to ALSPAC Questionnaires Dr Isabelle Bray ALSPAC Scientific Conference 18/04/12.

E N D
Factors Influencing Response Rates to ALSPAC Questionnaires Dr Isabelle Bray ALSPAC Scientific Conference 18/04/12
“One of the greatest challenges facing longitudinal surveys is to establish maximum representativeness of the cohort at the outset and to maintain this representativeness throughout the follow-up period” Large Cohort Studies Across the World, Pirus & Leridon 2010
Initial response to child cohort studies (UK, US and Canada) % Designing Multidisciplinary Longitudinal studies of Human Development: Analyzing Past Research to Inform Methodology, Shulrufet al. 2007
Reasons for non-response • Failure to locate • Failure to contact • Refusal to take part
Reasons for non-response • Failure to locate • Increasing residential mobility • Failure to contact • Refusal to take part
Reasons for non-response • Failure to locate • Increasing residential mobility • Failure to contact • More mothers working • Busier lives & increased affluence - more likely to be out • Refusal to take part
Reasons for non-response • Failure to locate • Increasing residential mobility • Failure to contact • More mothers working • Busier lives & increased affluence - more likely to be out • Refusal to take part • Sense of obligation to participate appears to have declined over time • Recent studies cover more aspects of participants lives and often include more intrusive information • Increase junk mail, telesales calls
Why do response rates matter? Sample size (i) precision of estimates (ii) ability to look at subgroups Representativeness/Bias Participation at 16-18 yrs Cohort Profile: The ‘Children of the 90s’; the index offspring of The Avon Longitudinal Study of Parents and Children, Boyd et al 2012 (in press)
Response rates to questionnaires Numerator - number of questionnaires completed
Response rates to questionnaires Numerator - number of questionnaires completed Denominator Eligible sample – defined area of Avon, EDD 01/04/91-31/12/92 Enrolled sample – mother or child has provided some data Sent questionnaire – depends on participants choice & previous response
Response rates to questionnaires Numerator - number of questionnaires completed Denominator Eligible sample – defined area of Avon, EDD 01/04/91-31/12/92 Enrolled sample – mother or child has provided some data Sent questionnaire – depends on participants choice & previous response Number completed Number sent
Questionnaire Response % Age of cohort (years)
Questionnaire Response % Age of cohort (years)
Questionnaire Response % Age of cohort (years)
Questionnaire Response % Age of cohort (years)
Questionnaire Response % Age of cohort (years)
Questionnaire Response % Age of cohort (years)
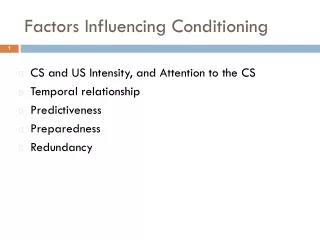
Factors affecting response Individuale.g. age, gender, education, marital status Familye.g. socio-economic status, ethnicity Organisationale.g. reminders, home visits/phone calls
Analyses of response 1970 British Cohort StudyLogistic regression performed separately for each wave of the study. Gender, mothers age at birth, social class of father, birthweight, parents’ education, parity and marital status predicted response. Non-response in the 1970 British Cohort Study from birth to 34 years Ketende, McDonald and Dex 2010 UK Millenium Cohort Study. Mobility since wave 1, country, income, ethnicity, housing tenure, age, education and Child Poverty Index predicted response at wave 2 The contribution of residential mobility to sample loss in a birth cohort study: Evidence from the first two waves of the UK Millenium Cohort Study, Plewiset al 2008
Multilevel model of ALSPAC data • Binary dependent variable – questionnaire completed
Multilevel model of ALSPAC data • Binary dependent variable – questionnaire completed • Explanatory variables: • Individual/Family (e.g. education, marital status, parity) • Organisational (e.g. length of questionnaire, reminders, home visits)
Multilevel model of ALSPAC data • Binary dependent variable – questionnaire completed • Explanatory variables: • Individual/Family (e.g. education, marital status, parity) • Organisational (e.g. length of questionnaire, reminders, home visits) • Time in study (from first questionnaire)
Multilevel model of ALSPAC data • Binary dependent variable – questionnaire completed • Explanatory variables: • Individual/Family (e.g. education, marital status, parity) • Organisational (e.g. length of questionnaire, reminders, home visits) • Time in study (from first questionnaire) • In addition, • Initial probability of response • Decline in response over time allowed to vary by individual • Relationship between the two
Final model – Mothers Young People, by gender Age of cohort (years)
Conclusions • Individual/family effects confirm expected findings • Reminders & visits/phone calls improve response rates • Longer questionnaires associated with lower response rates • Time in study – overall drop in response rates over time
Further work - Questionnaires • Modelling continuous variables: • Length of questionnaire – threshold effect? • Time in study - consider change-points • More precise measurement –timings of questionnaires & reminders from administrative data • Other influences – family, school, friends
Further work - Clinics • Clinics – similar analysis for clinic attendance • Substudies – participant burden v benefit of more frequent contact