Methodology for the Quantification of protein
230 likes | 453 Vues
Methodology for the Quantification of protein.

Methodology for the Quantification of protein
E N D
Presentation Transcript
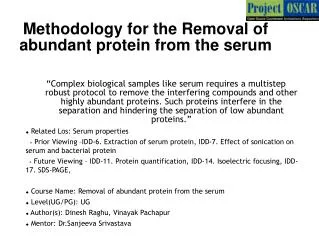
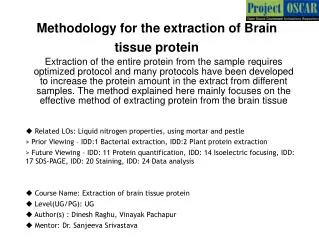
Methodology for the Quantification of protein Protein quantity varies based on the type of tissues, mode of extraction, handling techniques and the content of the cell. Proteins have to be quantified after extraction, to look for any other impurities that are present and to have knowledge about the quantity of protein to be used for further experiments. In some cases it helps to determine whether the protocol used for extraction is efficient one or not • Related Los: Plotting graph, using nano-view intrument > Prior Viewing – IDD-6. Extraction of serum protein, IDD-9. Removal of abundant proteins in serum > Future Viewing – IDD-13. Cyanine dye labeling, IDD-14. Isoelectric focusing • Course Name: Protein Quantification • Level(UG/PG): UG • Author(s):Dinesh Raghu, Vinayak Pachapur • Mentor: Dr. Sanjeeva Srivastava *The contents in this ppt are licensed under Creative Commons Attribution-NonCommercial-ShareAlike 2.5 India license
Learning objectives 1 After interacting with this learning object, the learner will be able to: • Identify the methodology to quantify the protein. • Estimate the reagents preparation for quantification. • Infer the steps involved to perform experiment. • Assess the troubleshooting steps involved in the experiments. 2 3 4 5
Master Layout 1 Labeling the tubes (Slide:5) Thawing the frozen sample (Slide:6) 2 Taking standards and sample (Slide:7) 3 Making the volume with buffer (Slide:8) Addition of Bradford reagent (Slide:9-10) Mechanism of Bradford reagent (Slide:11) 4 Absorbance reading (Slide:12-14) Plotting the standard graph (Slide:15) 5
Definitions and Keywords 1 • 1.Protein : Proteins are the biomolecules, composed of amino acid which forms the building block of the system and performs most of the function of the system. 2. BSA: Bovine Serum Albumin is used as the standard protein, who's concentration is already known to plot the graph. BSA extracted from the calf’s serum is used as reference protein to calculate the protein concentration for unknown sample. • 3.Bradford reagent: The Bradford reagent consists of Coomassie Brilliant Blue, G250, ethanol, Phosphoric acid. It quantifies protein by converting red form of coomassie blue to blue one as a result of electron transfer reaction when the dye binds to the protein. The color solution is later used to read the absorbance. • 4. UV-Visible spectrometer: Ultraviolet –Visible spectrometer quantifies the protein concentration by using the light absorption property of amino acid especially phenylalanine, tryptophan and tyrosine. 2 3 4 5
Audio Narration (if any) Description of the action/ interactivity Show the box with fresh tubes from the rack, let user takes out tubes from the box, and place it in the stand as shown. Animate like user taking the marker and start labeling the tubes in order(B, 1-5 for standard), S1 and S2 for samples. The user should click on the hand so that the labeling has to happen. Please redraw the figures as shown. Step 1: T1:Labeling the tubes 1 2 3 Label the tubes for the standards-1 to 5, blank-B and sample in duplicates-S1,S2. duplicates are necessary while doing quantification eves for standards also but depends on user. 4 5
Step 2: T2:Thawing the frozen sample 1 frozen sample 2 Description of the action/ interactivity Audio Narration (if any) 3 Animate user taking out the sample from -20’C freezer by opening the freezer. The solution inside the tube must look like frozen. Now instruct user to thaw the tube, by holding tube between palms with rubbing action (action should happen as user clicks on the hand). After thawing, display the change in phase to liquid form. Show a bucket of ice and animate like placing the tube on ice. Draw a tube labelled as BSA and animate like the user taking it from the 4'C fridge by opening the fridge and placing the tube on the ice. Thaw the frozen sample by rubbing between the palms and take the BSA standard and place it on the ice. 4 5
Step 3: T3:Taking standards and sample for quantification 1 2 Description of the action Audio Narration 3 The standard concentration of BSA is (2mg/ml). Pipette out BSA in increasing volume for increasing concentration, to draw the standard graph to calculate the concentration of unknown sample. Show labeled BSA standard tube, now instruct user to click on pipette and set the it at 5ul, animate like the user taking the 5ul of BSA from the tube and adding to tube labeled as “1” and follow the same steps by setting the pipette to 10ul,15ul,20ul 25ul and add to tubes labeled as “2,3,4,5” respectively and similarly show the sample tube and instruct user to set the pipette for 10ul to take out the sample and add to tubes labeled as S1 and S2 each. The pipette setting action should happen when the user clicks on the pipette. Please redraw the pictures 4 5
Audio Narration Description of the action Step 4: T4:Making the volume with water 1 2 3 Let user take out tube labeled as distilled water from -20'C freezer. Instruct user to set the pipette to 995ul to take out the water and add to the tube labeled as 1. now set the pipette to 990ul, 985ul,980ul,975ul,1000ul to take the water and add to tubes labeled as “2,3,4,5,B” respectively. Again set the pipette to 990ul and take the water and add to tubes S1 and S2. Animate for water addition to each tube with increase in the solution level to 1ml in the tube. Make the samples to equal volume using water 4 5
0.05% (w/v) Coomassie Brilliant Blue G250 25 % (v/v) Ethanol 42.5 % (v/v)Phosphoric acid Audio Narration (if any) Description of the action/ interactivity Let user takes out the bradford reagent bottle from the rack. Zoom-in Bradford reagent bottle. User must click on the bottle to get its constituents. Please redraw the figures Step 5: T5: Addition of Bradford reagent 1 2 3 The Bradford reagent consists of Coomassie Brilliant Blue G250, ethanol, Phosphoric acid. 4 5
Audio Narration Description of the action/ interactivity Animate like the user setting the pipette to 1000ul, open the cap of Bradford’s bottle and pipette out Bradford reagent solution (color should be red) into all the tubes one by one. Once the reagent is added the color of the solution must change from red to blue with gradient . Animate like the user takes each tube and invert it for mixing the contents . Show like tubes are allowed to stand for 15 minutes animate a clock showing 15 minutes Step 5: T5: addition of Bradford reagent 1 2 3 Add the Bradford reagent to the protein sample and standard tubes. Incubate for 15 minutes at room temperature. 4 5
Description of the action Audio Narration Animate the reaction, red circle must bind to brown thread like proteins and show unwinding of the thread as in figure, show a circle with negative sign (electron) in it moving from thread like thing to red circles and the red circles must turn to blue. For standard tubes show the blue color in increasing intensity like in tube:1 light blue and 2,3,4 the color need to be in increment mode tube:5 should be dark blue and for sample tube chose any of the color intensity between the tubes: 2-4 and Tube “B (Blank)” must be red in color. Step 5: T6: Mechanism of Bradford reagent 1 2 3 Red form of coomassie blue dye binds to the protein and the electron transfer reaction takes place which results in protein denaturation and color change in dye to blue. Color intensity is directly proportional to concentration of protein. 4 5
For absorbance set upoption and set the wavelength enter Power Auto zero Absorbance Audio Narration (if any) Description of the action/ interactivity Show the UV-Visible spectrometer as in figure . Animate the settings like ON, enter, set wavelength, OFF, “0”, absorbance and numbers 0-9, The user must click ON in the instrument and press the set wavelength 595nm (the user should click on numbers to set wavelength) Display should show “595nm”, absorbance. Step 6: T7: Absorbance reading 1 2 3 Switch On the instrument and set 595nm wavelength, which is used to the absorbance reading. 4 Video file: Spectrometer 5
Description of the action Audio Narration Show the cuvette and the show the distilled water bottle animate like the user taking the bottle and pouring water in cuvette , animate like the user taking the tissue paper and rubbing on sides of the cuvette and keeping inside the instrument and closing the lid as shown and “instruct the user to press “auto zero (0)” now show like opening the lid , taking the cuvette and pouring the water in the trash and instruct the user to take “tube B”(red in color) again rub with tissue at sides and place inside and close the lid and instruct the user to press “absorbance” and show the value as 0.489 in display and open the lid ,take the cuvette, throw the content to trash and washing and follow the same steps for tube 1-5 and S1 and S2. the corresponding reading to be displayed can be obtained from next slide Step 6: T7: Absorbance reading 1 2 3 Keep the sample in the spectrometer and press “absorbance “ button to get the readings for each standard and sample tubes. 4 5
Step 6: T7: Absorbance reading 1 2 3 4 5
Audio Narration Description of the action/ interactivity Display the table with Standard concentration in one row and Absorbance in other row. Plot the graph with these values. Taking standard concentration values as X-axis and Absorbance as Y-axis. Animate the absorbance value of sample to cut the graph when the user clicks on the s1 absorbance value from the table in previous slide and similarly for s2 . Show the result as 2.5ug/ul. Please redraw the figure Step 7: T8: Plotting the standard graph for protein Quantification 1 2 S1 S2 3 Plot the graph between the absorbance and the Concentration of BSA . The absorbance of the samples can be extrapolated and the concentration can be found. After calculating the protein concentration user can look into future IDD for information. 4 5
Button 01 Button 02 Button 03 Slide 6 Slide 9-10 Slide 7 Slide 8 Slide 11 5 Introduction Tab 01 Tab 02 Tab 03 Tab 04 Tab 05 Tab 06 Name of the section/stage Animation area INTERACTION 1: slide-7: in case user is unaware of the sample volume to be taken for Quantification. Instruction: user can start from minimum volume range say 1ul to 3ul. In case if user feels the sample contains more protein concentration, user can proceed by doing dilutions. INTERACTION 2: slide-10: if the sample color intensity is too high and is not fitting/matching with that of standards, ask for user input. Instruction: at this time user can dilute the sample tube with distilled water in 1:1 ration, further if the color intensity is high repeat the step to dilute it more. Interactivity area Instructions/ Working area Credits
Button 01 Button 02 Button 03 Slide 12-14 Slide 15 Tab 07 Tab 08 Tab 09 Tab 10 Tab 05 Tab 06 Tab 07 Name of the section/stage Animation area Interactivity area Instructions/ Working area Credits
Questionnaire: APPENDIX 1 Question 1 What is the constituent(s) of Bradford reagent? a)Commassie blue b)Ethanol c)Phosphoric acid d) All the above Answer: All the above Question 2 The purpose of BSA is • Standard protein whose concentration is known • Standard protein whose concentration has to be calculated • Standard protein whose concentration is unknown • Protein used for the quantification of the sample protein Answer: Standard protein whose concentration is known
Question 3 What is the absorption maxima of protein by UV spectrometer using Bradford reagent? a)590nm b)585nm c)595nm d)600nm Answer:595nm Question 4 In the graph x-axis and y-axis represents • Concentration of protein and Absorption • Absorption and OD • OD and Concentration of proteins • BSA and Unknown sample concentration Answer: Concentration of protein and Absorption Questionnaire: APPENDIX 1
Questionnaire: APPENDIX 1 Question 5 As a result of electron transfer the color of dye changes from a)Red to blue b)Blue to white c)Blue to red d)Red to green Answer: Red to blue
APPENDIX 2 Links for further reading • Book: • 2DE Tutorials by Angelika Gorg: www.wzw.tum.de/blm/deg/ • Reference websites: • www.piercenet.com/instructions/2160229.pdf
APPENDIX 3 Summary The steps involved in this experiment is tube labeling, Pipetting out the standard and sample, amking upto equal volume using rehydration buffer and addition of Braford reagent , incubation, taking the absorbance and finding the concentration of the sample The standard graph should be linear so that the protein concentration of the sample can be calculated accurately.