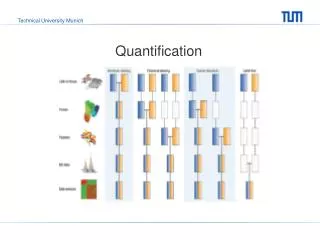
Protein quantification and PTM
Protein quantification and PTM . Jun sin Hss.i. Project 1. msms. MS analysis. Peptide Precursors. Fragmentation. MS/MS analysis. Peptide sequence information (on top of Mass and Charge). MS 1 v. ms 2. Mass spectrometry can help to detect posttranslational modification.

Protein quantification and PTM
E N D
Presentation Transcript
Protein quantificationand PTM Jun sin Hss.i
msms MS analysis Peptide Precursors Fragmentation MS/MS analysis Peptide sequence information (on top of Mass and Charge)
MS1 v. ms2 • Mass spectrometry can help to detect posttranslational modification. • MS is a tool for finding the molecular mass of a sample. • MS2 or MS/MS uses two mass spectrometers in tandem that has some “form of fragmentation occurring in between the stages.” • MS/MS is used to produce structural information by identifying the resulting fragment ions. • The stages of mass analysis separation can be accomplished by a single mass spectrometer with the MS steps separated in time.
ms2 • A peptide sequence tag obtained by tandem mass spectrometry can be used to identify a peptide in a protein database. • Peptide fragment ions are indicated by a, b, or c if the charge is on the N-terminus, and x, y, or z if the charge is maintained on the C-terminus. • Subscript indicates the number of amino acid residues in the fragment. y25 b1
B ion and y ion b3 b4 b5 b6 b7 b8 b9 b10 b11 b12 • The sequence of the peptide is determined by the mass difference between the peaks. • Confusingly, the y and b ions are intermixed; however, this mixing will help to establish a sequence, forward and backward. • The fragment peaks that appear to extend from the N-terminus are b ions. L L D E V F F S E KUb I Y K y12 y11 y9 y8 y7 y5 y4 y3 y2 N-terminus C-terminus
B ion and y ion Groups of peptide fragment ions appear to extend from the C-terminus, these peaks are termed, y ion. • The b fragments peaks are labeled from the amino to the carboxyl terminus. y ions being labeled in peptide GLSDGWQQVLNVWGK b ions being labeled in peptide GLSDGWQQVLNVWGK
Information given from spectra 3 Subunit Xcorr = 3.04 z = 2 m/z = 872.96 0.7ppm Xcorr: cross correlation Z: charge state of precursor peptide m/z: mass to charge ratio ppm: accuracy of the precursor measurement b3 b4 b5 b6 b7 b8 b9 b10 b11 b12 L L D E V F F S E KUb I Y K y12 y11 y9 y8 y7 y5 y4 y3 y2 100 1044.26 1118.33 1000.82 80 850.62 60 Relative Abundance 812.43 40 801.26 20 745.94 934.63 1217.88 1599.71 586.23 894.57 1237.26 779.12 1079.59 991.66 559.32 1159.64 533.31 1257.01 727.10 372.39 1397.84 525.32 1304.51 344.30 972.19 415.92 1356.65 1466.98 289.20 1749.37 1578.95 1692.13 0 400 600 800 1000 1200 1400 1600 m/z
Procedure on labeling spectra Main work Remove unnecessary markings along the axis of the spectra Clean up the spectra Outside Work Obtain the spectra from MS2 Label spectra peaks with corresponding ion values Incorporate into PowerPoint Subunit m/z Ppm Xcorr z B ion Y ion OW Receive data supplied by Uniprot and an Excel file OW Receive data supplied by Uniprot Publication
miape The minimum information about a proteomics experiment • Nat Biotechnol. 2007 Aug;25(8):887-93 Cover page 3rd page of paper
Recap of spectra labeling • A labeled spectra produces a lot of information: • Xcorr (cross correlation) • m/z (mass-to-charge ratio) • z (charge) • ppm
How to generate the internal standard • In order to find the differences between wild type and protected mice, nitrogen labeling was done. • The diet of the wild type contained 14N, while the IS mice had a specialized diet, in which all nitrogen was replaced with a heavy stable isotope, 15N. • Algae, the food for the mice, are able to produce proteins/amino acids (containing nitrogen-15) with the consumption of only ammonium. • When mice ingest the algae, they too produce amino acids and proteins labeled with 15N. The heavy nitrogen is found in the amine group of the amino acid. 15N-labeled Proteins 15N-labeled Amino Acids and Proteins Ammonium 15N-labeled Mice 15N-labeled Algae
Internal Standard • Although most of the proteins in the IS mice are labeled with 15N, the process does not label 100 percent of the nitrogen. • There is about 15 percent 14N left, which accounts for the wide spread of the peaks. • With an additional 8 more weeks, the labeling will approach 100 percent. Dihydrolipoyllysine acetyltransferase (PKC Tg vs. WT equals 0.6) GLETIASDVVSLASK PKCTg 100 Internal Standard 80 Relative Abundance 60 40 20 0 745 747 749 751 753 755 x10 m/z WT 100 80 Internal Standard Relative Abundance 60 40 20 0 745 747 749 751 753 755 x10 m/z
THE Silam project • The purpose of this project is to compare the protein expression of transgenic and nontransgenic mice. • However, the regression ratio between TG and NTG mice cannot be calculated directly, a reference point (SILAM mouse) is used for the calculation. • The experiment analyzed three SILAM, three TG, and three NTG mice. Ratio 1 Ratio 2 Ratio 3 Ratio 4 Ratio 5 Ratio 6 Three Final Measurements
Protein Information • Supplied by www.uniprot.org Protein Name and sequence of P02088
Quality of the peptide • Before starting the actual comparison, a quality check needed to be done. • The amino acid Methionine (M) was highlighted(disregarded) because of its susceptibility to oxidation of varying degrees. • Since trypsin cleaves proteins after Lysine (K) and Arginine (R), if K or R appeared in the middle of a peptide, a miscleavageoccurred. • If R or K appeared at the beginning of a sequence (…RK…KR…KK…RR…), then it was a miscleavage, because of its ambiguity. • Also every peptide had to end in a K or a R. When R or K appeared at the beginning of a sequence, or if K or R appeared in the middle of a peptide. Methionine
Calculating the ratios • Once all six adjusted ratios have been calculated, the TG/NTG ratios can be calculated. • The 4th and final “green box” is used for the average calculation of all three TG/NTG Ratios. The average ratio after all three SILAM ratios have been found. Final TG/NTG ratio for the protein D3Z3F4
Results of the Silam Project • With the final data, I was able to find the proteins that underwent no-change and change. • The proteins that changed either displayed up regulation or down regulation. • All proteins were counted and separated: Total changed: 100 Total: 287
acknowledgements • Dr. Ping • Nobel Zong • Laboratory Members
Thank you • For everything