Evolution of the Atmosphere
830 likes | 1.47k Vues
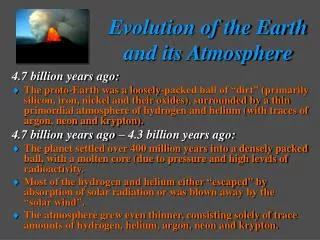
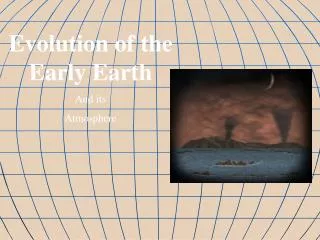
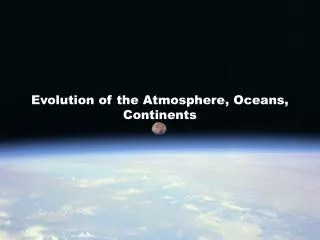
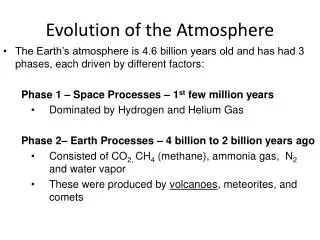
Evolution of the Atmosphere. The Earth’s atmosphere is 4.6 billion years old and has had 3 phases, each driven by different factors: Phase 1 – Space Processes – 1 st few million years Dominated by Hydrogen and Helium Gas Phase 2– Earth Processes – 4 billion to 2 billion years ago

Evolution of the Atmosphere
E N D
Presentation Transcript
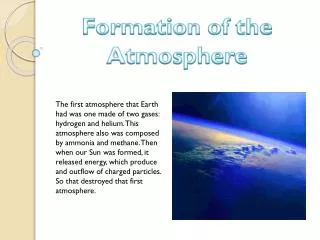
Evolution of the Atmosphere • The Earth’s atmosphere is 4.6 billion years old and has had 3 phases, each driven by different factors: Phase 1 – Space Processes – 1st few million years • Dominated by Hydrogen and Helium Gas Phase 2– Earth Processes – 4 billion to 2 billion years ago • Consisted of CO2, CH4 (methane), ammonia gas, N2 and water vapor • These were produced by volcanoes, meteorites, and comets
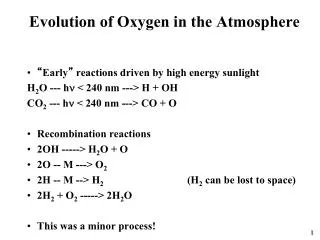
Evolution, cont Phase 3 – Biological Processes – 2 billion years ago to present • Photosynthetic algae produced oxygen as a waste product • Bacteria in sediments and wetlands “fix” ammonia gas to N2 (nitrogen gas)
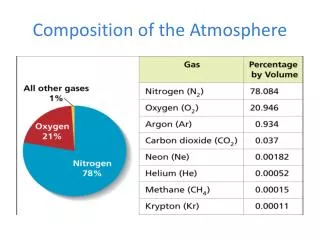
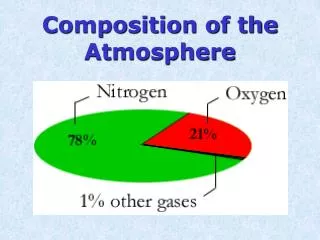
Atmospheric Composition • Pg 547-549 • Composition of pure, DRY Air • N2 gas – 78% • O2 gas – 21% • Other – 1% (includes CO2, Ar, Ne, NH4, CO, O3, etc. • Water vapor can vary from <1% - 4% • Can include Particulates
Atmospheric Pressure • Gravity holds all gases against the Earth’s surface • 99% of all gases are within 32km of the surface • Remaining 1% extends to approximately 9600km, exponentially decreasing with increased altitude • Pressure is force exerted on surfaces by the air, and is exerted equally on all sides • “Space” is defined as having less than <5 atoms per square meter
Barometers • Barometric pressure is the pressure exerted by the atmosphere • measured by a Barometer
Barometric Pressure • Weather Maps chart barometric Pressure with contour lines, just like topographic maps • Air Moves from HIGH Pressure to LOW Pressure • Similar to heat
Weather components Barometric pressure • There are 3 units used to measure pressure: • Atomospheres (atm) • - 14.7lbs/square inch (psi) • Millimeters or inches of mercury (from a mercurial barometer) • Millibars • 1 atm = 760mm (29.8 inches) = 1000 millibars • Standard atmospheric pressure at sea level is 1 atm
Structure of Atmosphere Troposphere – the lowest layer of the atmosphere, Temperature & pressure drops at a constant rate as altitude increases weather conditions exist.
Structure of Atmosphere Stratosphere – lies between the troposphere and mesosphere temperature increases as altitude increases. Contains the ozone layer. Mesosphere coldest layer of the atmosphere (temp ↓ as altitude ↑) Where meteors (aka shooting stars) occur
Structure of Atmosphere Thermosphere uppermost layer of the atmosphere temperature ↑ as altitude ↑ Includes the ionosphere where auroras occur.
Solar Energy in the Atmosphere • All of the energy the earth receives from the sun radiates through space in the form of electromagnetic radiation.
Solar Energy in the Atmosphere • As solar radiation passes through Earth’s atmosphere shorter wavelengths (Gamma rays, X-rays, UV rays) are absorbed in the upper atmosphere by nitrogen and oxygen (ozone). • Most very high frequency waves are blocked by Earth’s magnetic barrier (from the Core) • Most of the solar radiation that reach the surface have longer wavelengths (visible and infrared)
Why is the sky blue & sunsets red? Clouds, dust, gas molecules and water droplets scatter solar radiation. Scattering makes sunlight appear to come from all directions, sky blue and sunsets and rises red.
Solar Energy in the Atmosphere When energy reaches the Earth’s surface it is either absorbed or reflected. Light colored surfaces usually reflect (snow & ice) Dark colored surfaces usually absorb (ocean water) Albedo - fraction of solar radiation that is reflected by a particular surface.
Solar Absorption and Infrared Energy Mirages Heat radiating from a hot surface causes light to bend, distorting an image. Urban Heat Islands Heat radiating from concrete and buildings alters temperatures In urban areas.
Weather • Definition: the conditions of temperature and atmosphere over a short period of time. • (-18°F this morning isn’t global warming!) • Highly variable & susceptible to stochastic events (100-year floods, tornadoes, etc) • National Oceanic and Atmospheric Administration’s (NOAA) National Weather Service is the primary predictor of Weather
Atmospheric Circulation Coriolis Effect – the curving of the path of a moving object from an otherwise straight path due to Earth’s rotation. Winds blow from high pressure to low pressure areas and curve as a result of the Coriolis. The Coriolis is stronger for larger, fast moving winds and is the greatest at the poles.
Local Winds Land and Sea Breezes – Land heats faster than water causing the hot air over the land to rise and the cool air over the water to move in and take its place (ocean breeze). This reverses over night (land breeze)
Local Winds Mountain and Valley Breezes – In the morning warm air from the valleys move upslope. In the evening the mountains cool more quickly than the valley allowing cold air to descend.
Atmospheric Moisture • Humidity - water vapor in the atmosphere. • Absolute humidity - mass of water vapor per unit volume of air. • Relative humidity - the ratio of the amount of water vapor in the air to the amount of water vapor needed to reach saturation temperature. Dew point - temp at which the rate of condensation = rate of evaporation Frost is when temp is below freezing and water vapor sublimates into ice crystals
Adiabatic Cooling • Adiabatic cooling - As a mass of air rises it cools and expands. • This is because pressure decreases as altitude increases • As the air cools clouds and precipitation forms at the saturation point. • Remember Relative Humidity!! Saturation points decrease with temperature decrease. (think rain that doesn’t hit the ground) What do you think happens to a parcel of air as it sinks?
Air Masses • Air moves from an area of high pressure to an area of low pressure. • Air mass - large body of air throughout which temperature and moisture content are similar. • Air masses take on the humidity and temperature of the region from which they form.
Fronts • A front is a boundary between two air masses and there are four (4) types. • Cold front - cold air over takes warm air by wedging below the warm front and pushing it upward. • Results in short, sometimes violent storms
Fronts • Warm front - the front edge of advancing warm air mass replaces colder air with warmer air. • Results in precipitation over a large area. • Very gradual transition
Fronts • Stationary front - a front of air masses that moves either slowly or not at all. (weather remains constant; rain, drizzle or fog) • Occluded front - forms when a warm air mass is trapped between two colder air masses • Produces wide spread precipitation & heavy bands along occulusion http://apollo.lsc.vsc.edu/classes/met130/notes/chapter11/of_cold.html
Additional weather related videos … What is the Polar Vortex? What is Wind Chill? Who were the first skiers?
Midlatitude Cyclones • Midlatitude cyclone - an area of low pressure characterized by rotating wind moving toward the rising air of the central low-pressure region. • Lasts for several days • Produces strong storms followed by widespread precipitation. • Results in formation of occluded front • http://www.geography.hunter.cuny.edu/~tbw/wc.notes/9.weather.patterns/mid_cyclone_stages.htm
Mid Latitude Cyclone Development Steps of Formation http://www.youtube.com/watch?v=pm457OdgdnQ
Mid Latitude cyclones 6 steps of formation http://www.youtube.com/watch?v=pm457OdgdnQ Know the basics of how these form!!
Severe WeatherThunderstorms • Thunderstorm activity is associated with cumulonimbus clouds that generate heavy rainfall, thunder, lightning and occasional hail and tornadoes. • At any given time there are 2,000 T’storms on earth. 45,000/day! • Lightning strikes the earth 100 times each second!
Thunderstorm Development 1. Warm moist air rises creating a ~9 mile high cumulonimbus cloud. 2. Updrafts can reach >60mph & create hail. 3. downdrafts develop when amount and size of precipitation becomes to great, 4. gusty winds, lightning, heavy precipitation and sometimes hail can be experienced. • The cloud can dissipate rapidly unless more warm moist air is added. • Short video animation showing developement
Tornadoes • Tornadoes are violent local storms that take the form of a rotating column of air or vortex that extends down from a cumulonimbus cloud. • Strong updrafts and downdrafts caused by high altitude horizontal winds cause rotation. • Short video on tornado formation
Tornado Prediction Tornadoes are difficult to predict! - 75% of worlds tornados occur in the Great Plains, east of the Rocky Mountains (Colorado, Kansas, Oklahoma, Nebraska, Texas, South Dakota, Arkansas, Missouri) (see video) Tornado Watch – conditions are right for tornado formation. Tornado Warning – Tornado has been sighted in the area or indicated by radar.
Hurricanes • “Greatest storms on Earth” • Hurricanes allow distribution of tropical heat. • Atlantic = Hurricane // Pacific = Typhoon // Indian = Cyclone // Arctic = NOTHING!
Hurricane Formation 1. Form within 1,000 mile band along the equator. 2. Warm ocean water (80F) provides necessary heat and moisture. 3. Coriolis effect initiates rotation and is assisted by local low pressure systems 4. As winds increase, more moisture is absorbed from the sea. • Heat is released when moisture condenses into clouds, providing more energy • See video of Hurricane Formation • Another good one …
Hurricane Formation Tropical Disturbances – smaller tropical cyclones. Only a few develop into hurricanes. Tropical Depression - <35 mph Tropical Storms – 35 – 75 mph. 80 – 100 develop each year, half become hurricanes. Hurricanes – winds >75mph (Cat. 1) to >155mph (Cat.5) - Strongest winds ever recorded were Hurricane Camille, 1969, Biloxi, MS – 210mph - travel west, northwest, until they reach the midlatitudes (25 – 30) and go north northeast. (Hurricane Ivan in 2009)
Hurricane Damage Storm surge– most destructive part of hurricane, occurs when low pressure allows sea level to rise, causing flooding. - Worst at high tide Eye: Area of lowest pressure where all air is being pulled upward, causing horizontal wind to stop Strong winds and torrential rains also cause damage. Hurricanes diminish when: - Move over ocean waters that do not supply warm moist air. - Move on to land. - Reach a location where large scale flow aloft is unavailable.
Hurricane Prediction: link Actual results: link
Climate • Study of long-term weather patterns over of particular areas. • Accoding to NOAA, this time period is typically 30 years. • Presently NASA, NOAA, and the US EPA all study climate change • The concern here is that even small changes in global temperature can have huge economic and humanitarian impacts
Climate – Latitude and Seasons • Since the Earth is a sphere, the suns rays strike the surface at different angles. The greater the angle of the surface to the sun the less intense the radiation. • The tilt of the Earth causes changes in the angle of incoming radiation, resulting in seasons. • Great short video from Khan Academy on this topic
El Niño and La Niña • El Nino occurs when temperatures in eastern equatorial Pacific are unusually warm • increased rain for southern US and warmer temps for midwestern US (especially great plains
El Niño and La Niña • La Nina occurs when temperatures in the eastern Pacific are unusually cold. • Results most visible in winter, warmer & wetter in the Eastern US and cooler in the NW US • Video