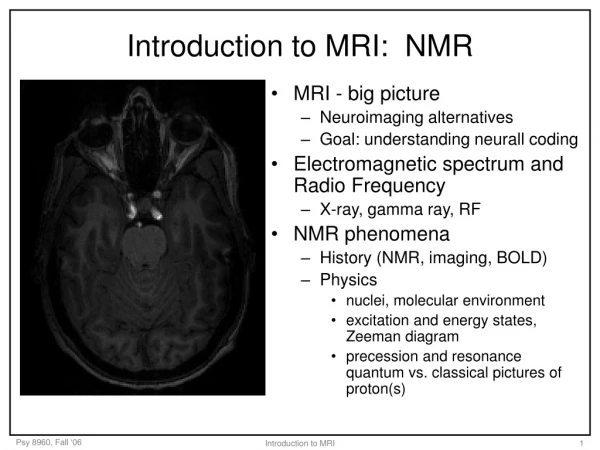
Introduction to MRI
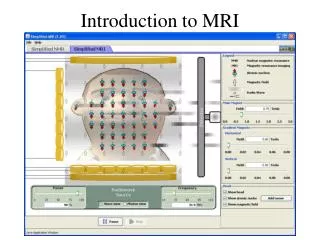
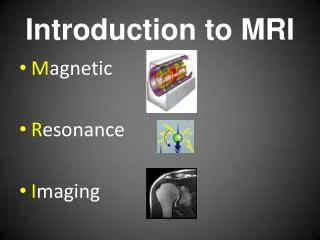
Introduction to MRI. M agnetic R esonance I maging. Bore 1.5-3.0 Tesla Super conductive Magnet, RF coils. Understanding and Reading MRIs. How is this MRI Image produce?. Numbers. Transforming Radio Frequencies into Images?.

Introduction to MRI
E N D
Presentation Transcript
Introduction to MRI • Magnetic • Resonance • Imaging
Bore 1.5-3.0 Tesla Super conductive Magnet, RF coils
Transforming Radio Frequenciesinto Images? Let’s step back, and look at a device that is familiar to all of us…the Radio
Encoded RF “1060 on your dial” RF decoded
The emitted energy of the protonsonce the RF is stopped is affected by in which tissue (the “lattice”) it resides: fat, muscle, ligament, bone, brain, etc.
RF Pulse sequence parameterswhich the technician adjusts • The three pulse sequence parameters are • Repetition time (TR) measured in msec • Echo time (TE) measured in msec • Flip angle measured in degrees
T1 and T2 relaxation times Occur simultaneously and independently of each other and form the basis of tissue contrast in MR-reconstructed images
T1 • Low TR (400-700 msec) • Low TE (20-40 msec) • T2 • High TR (2,000-3,000 msec) • High TE (40-70 msec) • Proton density • High TE (2,000-3,000msec) • Low TE (20-40 msec)
Basic Sequences • T1 to view anatomy • T2 to detect a pathologic process (edema, swelling) • Proton Density (PD) great for ligamentous anatomy
Fat Suppression A very valuable tool to define whether a structure is composed of water (bright) such as blood or fat (bone marrow)
TI Fat Water
T2 Fat Water
T2 Fat Suppressed Fat Water
Proton Density Fat Suppressed (PD-S) FAT Water