### Optical Evaluation of Crop Water Status in Olive Orchards Using Spectral Reflectance Indices ###
This study investigates the relationship between leaf water potential (LWP) and various vegetation indices (VIs) in olive orchards. Utilizing spectral reflectance measurements, we aim to provide a rapid, non-destructive method for assessing crop water status. Our results demonstrate that optimized VIs effectively predict LWP, particularly in the infrared region. Enhancing irrigation scheduling, these findings have significant implications for precision agriculture, potentially improving water management practices for olive cultivation. ###

### Optical Evaluation of Crop Water Status in Olive Orchards Using Spectral Reflectance Indices ###
E N D
Presentation Transcript
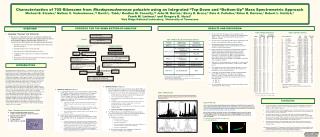
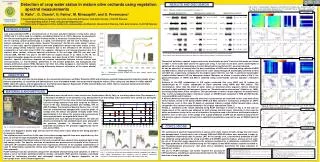
R2 R2 Canopy Reflectance Jackson, R. D, Huete AR (1991) Interpreting vegetation indices. Preventive Veterinary Medicine 11, 185–200. Kakani, V.G., Reddy K.R., ZhaoD(2007) Deriving a simple spectral reflectance ratio to determine cotton leaf water potential. Journal of New Seeds 8, 11–27. Natali, S., Bignami, C., Cammili, C. and Muganu, M. Effect of water stress on leaf movement in olive cultivars. Acta Horticulture, 1999, 474: 445-448. Turner, M.T., and G.P. Jarvis. Measurement of plant water status by the pressure chamber technique. 1982. Irrig. Sci. 9:289-308. Asner, G. P. (1998). Biophysical and biochemical sources of variability in canopy reflectance. Remote Sensing of Environment 64, 234–253. Carter, G. A. (1991). Primary and secondary effects of water content on the spectral reflectance of leaves. American Journal of Botany 78, 916–924. Esbensen, K., (2000). Multivariate Data Analysis – in practice, pp 598. CAMO, Corvallis, Norway, Oslo. Grant, L. (1987) Diffuse and specula characteristics of leaf reflectance. Remote Sensing of Environment 22, 309–322. REFERENCES Detection of crop water status in mature olive orchards using vegetation spectral measurements G. Rallo1*, G. Ciraolo2, G. Farina1, M. Minacapilli1, and G. Provenzano1 1) Dipartimento di Scienze Agrarie e Forestali. Università di Palermo, Viale delle Scienze, 13-90128 Palermo. *Correspondingauthor, e-mail: rallo.giovanni@gmail.com. 2) Dipartimento di Ingegneria Civile, Ambientale, Aerospaziale, dei Materiali. Università di Palermo, Viale delle Scienze, 13-90128 Palermo. RESULTS AND DISCUSSION Fig 4. Row 1: Contour plots showing the sensitivity (R2) of regressions between LWP and VIs. Row 2: Linear relationships between best VIs and LWP. Row 3: Measured vs predicted LWPs obtained using the optimized relationships. Table 1. Selection of optimal wavelengths for a given VI Canopy Standard definition of VIs Optimized VIs at canopy level Optimized VIs at leaf level EGU2013-464 INTRODUCTION Leaf water potential (LWP) is considered one of the most accurate indicator of crop water status (CWS) and it is often used for irrigation scheduling (Kakani et al. 2007). However, measurements are time-consuming and a high number of observations is necessary to characterize a plot. On the contrary, optical spectroscopy is a rapid, non-destructive and low cost technique for an indirect evaluation of crop water status. Several “broad-band” (50-100 nm scale) and/or “narrow-band” (10 nm scale) spectral signatures have been proposed to detect crop water status. In fact, leaf and canopy stress influence spectral reflectance due to the alteration in the structure and composition of leaf cells (Grant 1987). For example, changes in leaf internal structure due to a reduced water content, influence spectral reflectance in the red edge (680–740 nm) and near infrared (NIR, 740–940 nm) and in the 400–1300 nm regions (Inoue et al. 1993). In the IR, the strongest absorption properties of water molecules have been found at 1450, 1940 and 2500 nm. However, spectral reflectance depends on complex interactions between several internal and external factors, i.e. leaf thickness, differences in leaf surface properties, soil background and canopy architecture (Asner 1998). Moreover, for Olive tree (Olea europaea L.) leaf and the canopy spectral reflectance depend on the strong differences between reflectance of the leaves abaxial and adaxial surfaces (Fig. 1). R2c= Coefficient of determination between LWP and VIs obtained for calibration (N=39 and N=162 for canopy and leaf respectively). R2v= Coefficient of determination between LWP and VIs obtained for validation (N=17 and N=46 for canopy and leaf respectively). Leaf Theoretical definition, spectral regions and center wavelengths of each VI used in this works are shown in Table 1. In the same table and in the upper part of fig. 4, for each VI, the best center wavelengths of optimized VIs, evaluated according to the best determination coefficient (R2), are also indicated. As can be observed, at canopy level the best predictions of LWPs were obtained using optimized NDWI and MSI indices, which are directly related to the water status through IR wavelengths centered at 1615 and 1605 nm, respectively. Compared to the original value (1240 nm, see Tab. 1), optimized wavelengths resulted shifted toward 1600 nm absorption feature. Moreover, as shown in contour plots of Fig. 4, the good performance of NDWI and MSI is obtained using narrow-bands spectral signature (resolution <10nm). Analysis of VIs-LWP relationships in VIS region evidenced that even NDGI and GI indices are characterized by R2 values comparable of those obtained using NDWI and MSI indices. This circumstance, rather than the effect of water status on structural and/or pigment content, should be ascribed to light-avoiding leaf movement, known as “Paraheliotropism phenomena” (Natali et al., 1999), occurring during water stress conditions. This phenomenon involves a major exposure of abaxial leaves (Fig. 1) and consequently higher reflectance values in GREEN band compared to RED and NIR bands, increasing NDGI and GI indices. A different behavior has been observed when leaf measurements are examined. In fact, only water direct stress indices, based on IR bands (NDWI, SRWI and MSI), allowed a satisfactory prediction of LWPs. Nevertheless, even in this case IR bands of optimized indices resulted shifted toward higher values compared to the common values indicated in the original expressions (Table 1). Finally, a synthesis of the results obtained using PLSR technique is shown in Fig. 5. In this case an improvement of the results was obtained for both canopy and leaf levels. Obviously, in this case the better performance is due to the use of all bands of the spectra used in the bilinear multivariate analysis. However, even in this case, at the canopy level a good prediction of LWP can be obtained using only the VIS spectral regions, whereas at leaf level a satisfactory predictions requires the use of VNIR-IR spectral bands. Fig. 1 – Reflectance spectral response of the olive canopy, adaxial and abaxial leaf surface. OBJECTIVES The main aim of the work was to investigate on the connections between Leaf Water Potential (LWP) and reflectance spectral measurements treated by means of two different approaches: (i) extraction and optimization of a set of standard broad- and narrow-band vegetation indices, (VIs), using only two bands in visible and NIR (VNIR) and/or IR regions, and (ii) application of the Partial Least-Squares Regression (PLSR) method (Esbensen, 2000), that is a classical statistical multivariate technique obtained considering all the spectrum bands. MATERIALS AND METHODS Experiments were carried out in a farm located near Castelvetrano (Sicily, Italy), in a territory where olive (Olea europea L., cv Nocellara del Belice) is the prevalent crop. Measurements of leaf/canopy water potentials were carried out during the irrigation season 2011 on five trees at their full development stage. Experiments were carried out a) Leaf and canopy spectral firms were acquired at different hours of the day, including predawn and midday, with an ASD FieldSpec Pro (Analytical Spectral Device, Inc.). At leaf level the instrument was equipped with a contact probe. At canopy level, the sensor was placed vertically (nadir view), approximately 1,0 m above the canopy and measurements were acquired under an angular field-view of 25°. Immediately after each spectral measurement, one year old shoots containing the two sampled leaves were analyzed in the pressure chamber, to determine the leaf water potentials according to the protocol suggested by Turner and Jarvis (1988). Figure 5. Measured vs predicted LWPs obtained from PLSR method using VIS, VNIR and VNIR+IR domains. Canopy CONCLUSIONS Fig. 2 – Strumental equipment used for experiment Leaf Leaves were bagged in plastic bags and cut from the shoot with a razor blade before being placed in the pressure chamber. Two replicates were carried out in the same trees where canopy spectral firms were acquired every five days, as well as the days immediately before and after irrigation. A series of standard Vegetation Indexes (VIs) were extracted from spectral firms acquired both at leaf and canopy scale. The specific selection of waveband was performed on the basis of the Pearson’s coefficient (R2) obtained using the best linear regressions between all the possible combinations of each VI, obtaining by varying the central wave length of the considered spectral regions, and LWPs (first approach). PLSR technique was also assessed using all the waveband characterizing each spectrum, in order to obtain a set of leaf water potential predictive models, using both VNIR spectral response, essentially affected by leaf/canopy structure and chlorophyll content, and IR domain, dependent on the leaf/canopy water status (second approach). Leaf adaxial Reflectance The usefulness of spectral measurements to assess olive water status on both canopy and leaf levels was demonstrated. In particularly a set of known VNIR and VNIR+IR indices were optimized in order to find simplified relationships able to predict LWP. At the canopy level, a satisfactory prediction of LWP was obtained using optimized VIs using only RED and GREEN spectral regions, whereas at leaf scale the use of IR spectral region appeared as the minimum condition for a satisfactory estimation of LWP. The good prediction of LWPs obtained using the VIS region (GI and NDGI indices) could be ascribed to the “Paraheliotropism phenomena”, that under stress conditions, determines the major exposure of abaxial leaf surface. b) The use of PLSR technique can further improve the accuracy of LWP predictions, providing an useful operational tool for the indirect detection of crop water status. Fig. 3 – a) Dynamic of the leaf water potential cardinals (predawn and midday), water supply (precipitations plus irrigations) and b) spectral reflectance signatures set acquired to leaf (to the right) and canopy scale (left).