Download
1 / 1
10 likes | 97 Vues
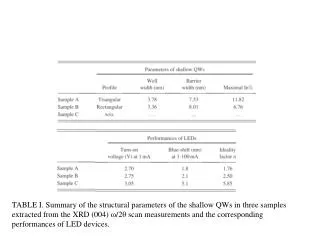
Study on Fecal Coliform levels and turbidity in Plum Creek, Ohio, influenced by land use, weather conditions, and spatial variability.

E N D
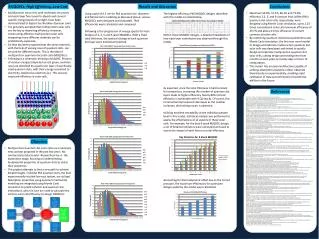
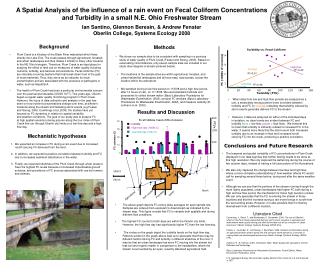
300 Fecal Coliform Counts (100s of colonies) 40 = turbidity FTU’s High-flow day (1000s C) 30 200 Low-flow day (100s C) 20 FC colonies (C) 100 10 0 x x x 0 12 10 Oberlin City Limits 2000 ft 11 8 6 7 9 500 m 5 3 4 2 North 1 Urban Forested Golf course Agricultural A Spatial Analysis of the influence of a rain event on Fecal Coliform Concentrations and Turbidity in a small N.E. Ohio Freshwater Stream Ian Santino, Glennon Beresin, & Andrew Fenster Oberlin College, Systems Ecology 2008 • Background • Plum Creek is a tributary of the Black River watershed which flows directly into Lake Erie. The creek passes through agricultural, forested, and urban landscapes and thus makes it similar to many other streams In the NE Ohio bioregion. Therefore, Plum Creek is an ideal place for studying the effect of land use on measures of water quality including nutrients, turbidity, and bacteria concentrations. Fecal coliforms (FC) are naturally occurring bacteria that help break down food in the guts of most mammals. Thus, they serve as an indicator for fecal contamination and are associated with the presence of pathogens in water, such as Hepatitis A. • The health of Plum Creek has been a particular environmental concern over the past several decades (USGS 1977). Two years ago, Oberlin began a regular water quality monitoring program in Plum Creek. However, the focus of data collection and analysis in the past has been on how nutrient concentrations change over time, at different locations along the stream and following storm events (e.g Feeser and Soong, 2006, Cummings et al.,2006). No studies have yet focused on FC dynamics in relation to spatial variability and weather conditions. The goal of our study was to analyze FC at high spatial resolution during autumn along the four miles of Plum Creek that run through Oberlin city limits on a low flow day and a high flow day. • Methods • We chose our sample sites to be consistent with sampling in a previous study of water quality of Plum Creek (Feeser and Soong, 2006). Based on extenuating circumstances, only eleven sample sites are included in our study (See diagram of stream pictured below). • The locations of the sample sites are within agricultural, forested, and urban/residential landscapes and all have easy road access, except the location within the arboretum. • We sampled during a low flow period on 11/5/08 and a high flow period, after 12 hours of rain, on 11/15/08. We used standard methods and procedures to collect stream water (Basic Laboratory Procedures for Wastewater Examination, 2002), conduct FC analysis (Basic Laboratory Procedures for Wastewater Examination, 2002), and measure turbidity (R. Johnson et al. 2002). Turbidity vs. Fecal Coliform 14 10 High-flow Average R2=0.22 FC (1000s of colonies) R2=0.61 6 2 Low-flow R2=0.08 0 0 20 40 60 80 100 120 140 160 Turbidity (FTU) • When data from low and high flow periods are analyzed as a unit, a moderately strong positive trend is evident between turbidity and FC (in orange), indicating that turbidity induced by storm events generally delivers FC to the stream. • However, if data are analyzed for either of the individual days in isolation, no clear trends are evident between FC and turbidity (blue = low flow, purple = high flow). We interpret this to mean that turbidity is indirectly related to increased FC in the water. It seems more likely that the storm event both increased turbidity due to an increase in flow and increased runoff carrying FC into the creek, producing a positive correlation. • Results and Discussion • The above graph depicts FC colony plate averages for each sample site. Samples are ordered from upstream to downstream as indicated by the stream map. This figure reveals that FC is variable both spatially and during different flow conditions. • The highest FC counts for both days are within the Oberlin city limits. However, the high flow day had significantly higher FC than the low flow day. • The circles on the graph depict the turbidity levels on the high flow day. Patterns evident in the graph above lead us to speculate that there may be different factors driving FC and turbidity in different stretches of the river; it may be that an urban landscape has more FC moving into the stream but less soil and organic matter in comparison to the headwaters, where the stream is surrounded by an open, recently disturbed agricultural field. Mechanistic hypotheses 1. We expected an increase in FC during a rain event due to increased runoff carrying FC delivered from the land. 2. In addition, we expected a positive correlation between turbidity and FC due to increased sediment disturbance in the water. 3. Finally, we expected stretches of the Plum Creek through urban areas to have the highest FC levels because of increased impermeable ground surfaces, and prevalence of FC sources associated with use by humans and animals. • Conclusions and Future Research • The temporal and spatial variability of FC concentrations in Plum Creek displayed in our data signifies that further testing needs to be done at this high resolution. We only captured the patterning during the course of two autumn days, instead of having a full year picture of the fluctuations. • We also only captured the change between low flow and high flow, where a more complete understanding of how weather affects FC would call for sampling several times before, during and after the same weather event. • Although we can see that the portions of the stream running through the more highly populated, urban landscapes had higher FC both during a high and low flow period, the mechanism for those high levels is unclear. We can only speculate that the FC is entering the stream in those locations and that the increase during a rain event brings in runoff from the surrounding areas. However, it is also possible that it is flowing downstream from a different location. Literature Cited Cummings, J., Reed, T., and Weinberger, K. December, 2004. The city of Oberlin’s effect on the Plum Creek watershed during a storm event: variation in upstream and downstream water quality during and after storm water run-off as a function of urban land cover. Oberlin College, Systems Ecology (ENVS 316). Feeser, J., Lauterbur, E., and Soong, J. December, 2006. Nutrient concentrations along an agricultural/urban stream during low flow and post-storm periods as a function of varying land-use and biological processing. Oberlin College, Systems Ecology (ENVS 316). Johnson, R., S. Holman and D. Holmquist. 2002. Water quality with calculators. Vernier Software and Technology. Basic Laboratory Procedures for Wastewater Examination, Fourth Edition, Water Environment Federation, 2002. U.S. Geological Survey flow and water quality data for Plum Creek for a 3 month period in 1977