Download

1 / 94
950 likes | 1.49k Vues
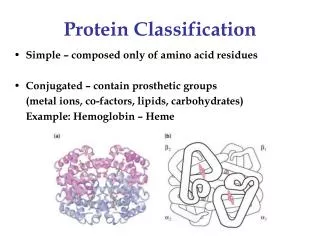
Protein signatures, classification and functional analysis. Menu. Introduction: some definitions How to model domains ? Pattern Profile HMM Domain/ family databases ( InterPro …). P rotein domain/family: some definitions. Most proteins have « modular » conserved structures

E N D
Menu • Introduction: somedefinitions • How to model domains ? • Pattern • Profile • HMM • Domain/familydatabases (InterPro…)
Protein domain/family: some definitions • Most proteins have « modular » conservedstructures • Estimation: ~ 3 domains / protein -> Prediction of domain content of a unkownproteinsequencemay help to find a ‘function’ …Estimation: ~ 80% of protein have at least a ‘known’ domain
Number of domains per protein ~100 proteinsequenceswith 50 domains http://prodom.prabi.fr/prodom/current/archives/2006.1/stat.html
CSA_PPIASE TPR TPR TPR Cys 181: active site residue Bindingcleft (motif) Example of conserved regions (PPID family) - 1 CSA_PPIASE (cyclophilin-type peptydil-prolylcis-trans isomerase) (domain) - 3 TPR repeats (tetratrico peptide repeat). - 1 active site - Bindingcleft (motif)
General definitions of conserved sequence signatures • Conserved regions in biological sequences can be classified into 5 different groups: • Domains: specific combination of secondary structures organized into a characteristic three dimensional structure or fold. • Families: groups of proteins that have the same domain arrangement or that are conserved along the whole sequence. • Repeats: structural units always found in two or more copies that assemble in a specific fold. Assemblies of repeats might also be thought of as domains. • Motifs: region of domains containing conserved active or binding residues, or short conserved regions present outside domains that may adopt folded conformation only in association with their binding ligands. • Sites: functional residues (active sites, disulfide bridges, post-translation modified residues).
CSA_PPIASE TPR TPR TPR Cys 181: active site residue Bindingcleft (motif) Example of conserved regions (PPID family) - 1 CSA_PPIASE (cyclophilin-type peptydil-prolylcis-trans isomerase) (domain) - 3 TPR repeats (tetratrico peptide repeat). - 1 active site - Bindingcleft (motif)
Measures of Conservation • Identity: Proportion of pairs of identical residues between two aligned sequences. Generally expressed as a percentage. This value depends on how the two sequences are aligned. • Similarity: Proportion of pairs of similar residues between two aligned sequences. If two residues are similar can determined by a substitution matrix (e.g. BLOSUM62). This value depends strongly on the scoring system used. • !!! But not Homology: Two sequences are homologous if and only if they have a common ancestor. This is not a measure of conservation and there is no percentage of homology! (It's either yes or no). Homologous sequences do not necessarily serve the same function, nor are they always highly similar: structure may be conserved while sequence is not.
How to measure ‘conservation’ ?Pairwise vs multiple sequencealignments Blast vs modelled MSA
Domain Family databases Detect conservation usingpairwisealignments A popular way to identify similarities between proteins is to perform a pairwise alignment (Blast, Fasta). When the identity is higher than 40% this method gives good results. However, the weakness of the pairwise alignment is that no distinction is made between an amino acid at a crucial position (like an active site) and an amino acid with no critical role (not enough information).
Detect conservation using MSA • A multiple sequence alignment (MSA) gives a more general view of a conserved region by providing a better picture of the most conserved residues, which are usually essential for the protein function. • MSA containshigher information content thanpairwisealignments
How to use MSA to look for conservation ?-> 1- Model MSA usingvariousmethods-> 2- ‘Align’ the model withyoursequence (InterPro scan…)
Domain Family databases Methods to Build Models of MSA • Consensus: • Consensus, Patterns • Profile: • Position SpeficicScoring Matrices (PSSMs), • Generalized Profiles, • Hidden Markov Models (HMMs), • PSI-BLAST. …pattern or PSSM/profile specificiscalleddescriptor, descriptor motif, discriminator or predictor
Why do we need models of MSA?Why do we need classifiers ? • to resume in a single “descriptor" the differences and similarities observed in each column of the MSA; • to use the model/descriptor to search for similar sequences; • to classify similar sequences; • to align correctly important residues and detect variations in active sites and other important regions of one protein (i.e. SNP); • to build databases of models/descriptors which can be used to annotate new proteomes… • MSA models are more sensitive than Blast (pairwisealignment) • …
Domain Family databases Consensus Sequences • Useful to detect protein belonging to a specific family or a protein domain; much less useful at the DNA level due to the small alphabet (4 letters) and the low sequence conservation of DNA sequence elements (except for the detection of enzyme restriction sites). • Patterns do not attempt to describe a complete domain or protein family, but simply try to identify the most important residue combinations, such as the catalytic site of an enzyme. • They focus on the most highly conserved residues in a protein family (motifs, sites).
Domain Family databases Use of pattern • Patterns are used to describe small functional regions: • Enzyme catalytic sites; • Prosthetic group attachment sites (heme, PLP, biotin, etc.); • Amino acids involved in binding a metal ion; • Cysteines involved in disulfide bonds; • Regions involved in binding a molecule (ATP, calcium, DNA etc.) or a protein. • N-glycosylation sites
Domain Family databases How to Build a PROSITE Pattern • Start with a multiple sequence alignment (MSA)
Domain Family databases Consensus Sequences: PROSITE Patterns syntax The PROSITE patterns are described using the following conventions: ex: <M-R-[DE]-x(2,4)-[ALT]-{AM} 1. The standard IUPAC one-letter codes for the amino acids are used. 2. The symbol `x' is used for a position where any amino acid is accepted. 3. Ambiguities are indicated by listing the acceptable amino acids for a given position, between square parentheses `[ ]'. For example: [ALT] stands for Ala or Leu or Thr. 4. Ambiguities are also indicated by listing between a pair of curly brackets `{ }' the amino acids that are not accepted at a given position. For example:{AM} stands for any amino acid except Ala and Met. 5. Each element in a pattern is separated from its neighbor by a ‘-’. 6. Repetition of an element of the pattern can be indicated by following that element with a numerical value or, if it is a gap ('x'), by a numerical range between parentheses. Examples: x(3) corresponds to x-x-x x(2,4) corresponds to x-x or x-x-x or x-x-x-x A(3) corresponds to A-A-A Note: You can only use a range with 'x', i.e. A(2,4) is not a valid pattern element. 7. When a pattern is restricted to either the N- or C-terminal of a sequence, that pattern either starts with a `<' symbol or respectively ends with a `>' symbol.
You can also automatically build a pattern (from MSA) by using Pratt or Splash softwares: http://www.expasy.org/tools/pratt/ http://www.research.ibm.com/splash/ Automaticdiscovered patterns are usuallydifferentfromthosedesigned by a human expert withknowledge of the biochemicalliterature
http://www.expasy.org/tools/scanprosite/ http://www.expasy.org/tools/scanprosite/
Domain Family databases Advantage and Limitation ofPROSITE Patterns • Advantages: • efficient for the identification of sites or short motifs. • Intelligible to any user, you don’t need to be an expert in bioinformatic to read or build a consensus sequence. • Limitation: • The regular expression syntax is too rigid to represent highly divergent domains. (one mismatch is enough to eliminate a match).
PSSM Profile specificscoring matrix
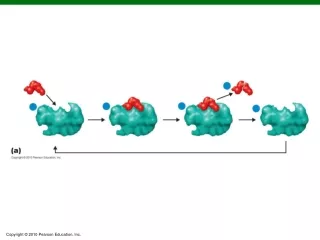
Domain Family databases Position Specific Scoring Matrix (PSSM) • A PSSM or a profile isbased on the frequencies of eachresidueat a specific position in a MSA. • The MSA is converted into a matrix where a score is given to each amino acid at each position of the MSA according to the observed frequency(positive scores for expected amino acids and negative scores for unexpected ones).
Domain Family databases Construction of a PSSM 1: weight sequencesof the MSA (i.e. algorithms based on phylogenetic tree) 2: count the number of occurrence of the different amino acids (or bases) at each position of the alignment 3: derivation of the preliminary matrix (calculate the frequency) 4: correction of the sample bias (use substitution matrix (PAM, Blosum etc.) In proteinssomemismatches are more acceptable thanothers.
Profile (or weight matrix) (residue frequency at each position in alignment) Profiles Sequence alignment Sequence 1: Sequence 2: Sequence 3: Sequence 4: Sequence 5: Sequence 6: Sequence 7:
Profile (or weight matrix) (residue frequency at each position in alignment) Profiles Sequence alignment Sequence 1: Sequence 2: Sequence 3: Sequence 4: Sequence 5: Sequence 6: Sequence 7: F most frequent Phenylalanine hashighest score
Profile (or weight matrix) (residue frequency at each position in alignment) Profiles Sequence alignment Sequence 1: Sequence 2: Sequence 3: Sequence 4: Sequence 5: Sequence 6: Sequence 7: L and Y equal frequency Different scores
Profile (or weight matrix) (residue frequency at each position in alignment) Profiles Sequence alignment Sequence 1: Sequence 2: Sequence 3: Sequence 4: Sequence 5: Sequence 6: Sequence 7: L and Y equal frequency Leucine is aliphatic (dissimilar from F) Tyrosine and phenylalanine both aromatic (similar)
Profiles Sequence 1: Sequence 2: Sequence 3: Sequence 4: Sequence 5: Sequence 6: Sequence 7: Profiles score frequency • Highest frequency aa highest score • Lower frequency aa lower score • Similar aa not in alignment even lower score • Dissimilar aa not in alignment very low score ** In a pattern would be [FLY] equal frequency
Domain Family databases Search a Database With a PSSM • The sequence (MCFVNRFYSFCMP) is ‘aligned’ to the PSSM: M C A C D E F G H I K L M N P Q R S T V W Y F V 1 12,-41,-20, 5,-25,-42,-18,-18, 33,-12,-12,-19,-41, 42, 9, 2, 9, 16,-61,-11; N 2 -23,-54, -5,-24,-37,-19,-45, -3, 7,-35,-38, 59,-41,-12,-42, 10, 65,-17,-68,-15; R 3 -13,-62,-14, 4,-53, 78,-36,-65,-15,-64,-49,-14,-48, 9, 5,-10,-11,-63,-61,-42; F 4 -36,-68,-63,-36, 60,-63,-38,-14,-47, 3,-21,-52,-53,-34,-58,-39,-45,-26,138, 36; Y 5 -22,-60,-54,-24, 6,-43, 0, 30, 13, 0,-22,-27,-59, 55, -9,-38,-11, 37,-57, 12; S 6 -35,-46,-18, 14, -9,-51,-12,-19, 34,-39,-28, 36,-45, 44, -9, -3, 41,-27,-24, 17; F 7 -33,-58, 37, -6,-16,-39,-21, 61,-23, -1,-28, -6,-58,-17,-54,-20, -9, 14,-12, 11; C M P Searching algorithm: sliding windows. At each position of the sliding window the score is obtained by summing the score of all columns Best score: 16+59+5+60+12-3-16=133
Avantages and limitations of PSSMs • Advantages: • The score producedpermits to estimate the quality of the match produced. • The methodisrelativelyfast and simple to implement • Limitations: • Indels are forbidden: long regioncan not beimplement.
PSSM: Fingerprints • To overcome the gap limitation of PSSMs, two or more PSSMscanbeused to describe long regions. The combination of variousPSSMsiscalled ‘fingerprints’ • PRINTS databaseis a collection o annotatedfingerprints(usefull to definesub-families)
A generalized profile is an extension of the PSSM, in whichweintroduce position specificdeletion and insertion penalties.
Domain Family databases Generalized Profiles The following information isstored in anygeneralized profile: • Each position iscalled a match state. A score for everyresidueisdefinedateverymatch states (M), just as in the PSSM. • Each match state canbeommitted in the alignment, by whatiscalled a deletion state (D) and receives a position-dependent penalty. • Insertion of variable lenght are possible betweenanytwo adjacent match (or deletion) states. Theseinsertion states (I) are given a position-dependent penalty thatmightalsodependupon the insertedresidues. • A couple of additionalparametersallow to adapt the behaviour of the profile on itsextremitieswhichcan force to match the wholedomain or produce partial matches.
Domain Family databases Example of a Generalized Profile ID ZF_RING_2; MATRIX. AC PS50089; DT DEC-2001 (CREATED); DEC-2001 (DATA UPDATE); DEC-2004 (INFO UPDATE). DE Zinc finger RING-type profile. MA /GENERAL_SPEC: ALPHABET='ABCDEFGHIKLMNPQRSTVWYZ'; LENGTH=43; MA /DISJOINT: DEFINITION=PROTECT; N1=5; N2=39; . . . MA /DEFAULT: D=-20; I=-20; B1=0; E1=-10; MI=-105; MD=-105; IM=-105; DM=-105; M0=-5; MA /I: B1=0; BI=-105; BD=-105; MA /M: SY='C'; M=-10,-20,119,10,0,-20,-30,10,-30,-30,-20,-20,-20,-40,-30,-30,-10,-10,-10,-50,-30,-30; MA /M: SY='P'; M=-1,-9,-21,-10,-4,-17,-14,-10,-11,-8,-14,-8,-6,4,-5,-10,0,-1,-10,-27,-14,-6; MA /M: SY='I'; M=-7,-27,-24,-32,-25,-1,-32,-25,32,-22,16,15,-21,-23,-19,-21,-17,-7,25,-21,-3,-24; D=-3; MA /I: I=-3; DM=-16; MA /M: SY='C'; M=-10,-20,119,-30,-30,-20,-30,-30,-30,-30,-20,-20,-19,-40,-30,-30,-10,-10,-10,-50,-30,-30; MA /M: SY='L'; M=-10,-12,-17,-14,-9,-1,-19,-7,-7,-9,2,2,-11,-21,-8,-7,-12,-8,-7,-17,1,-9; MA /M: SY='E'; M=-8,9,-22,12,17,-24,-13,-3,-23,2,-20,-15,5,-11,6,-2,3,-2,-19,-29,-15,11; MA /M: SY='E'; M=-7,-4,-23,-4,1,-16,-17,-8,-12,-2,-12,-8,-2,-5,-3,-3,-3,-2,-11,-25,-10,-2; MA /M: SY='F'; M=-10,-19,-24,-21,-13,7,-24,-11,4,-15,6,7,-16,-13,-12,-13,-15,-9,-2,-12,6,-13; . . . //
Align the generalized profile with a sequence…. (Dynamicprogramming, ~Smith Waterman algorithm) to bealignedwiththis profile… asequence
Domain Family databases Algorithm and Software to buid and use Generalized Profiles • Pftoolsis a package to perform the differentsteps of the construction of a profile and to search a database of protein (or DNA) with a profile. • http://www.isrec.isb-sib.ch/ftp-server/pftools • Searchingalgorithm: dynamic programming (similar to Smith-Waterman algorithm). -> guaranteed to find the optimal local alignment with respect to the scoring system being used (which includes the substitution matrix and the gap-scoring scheme)
http://www.expasy.org/tools/scanprosite/ http://www.expasy.org/tools/scanprosite/