Download
1 / 31
310 likes | 531 Vues
Use of Climate Forecasts in Hydrologic Prediction Applications. Alan F. Hamlet Dennis P. Lettenmaier JISAO/CSES Climate Impacts Group Dept. of Civil and Environmental Engineering University of Washington. Weather Forecasts Flood Control and Hydropower Management Flood Forecasts.

E N D
Use of Climate Forecasts in Hydrologic Prediction Applications Alan F. Hamlet Dennis P. Lettenmaier JISAO/CSES Climate Impacts Group Dept. of Civil and Environmental Engineering University of Washington
Weather Forecasts Flood Control and Hydropower Management Flood Forecasts Seasonal to Interannual Climate Forecasts Seasonal Streamflow Volumes Water Resources Management Climate Change Scenarios Long-Range Streamflow Forecasts Water Resources Planning 1hr - 1 week 1– 24 months 10-100 years Forecast Lead Time
Example of a Seasonal Forecasting System Based on Regression Models NRCS SNOTEL Network NRCS/NWRFC Water Supply Forecasts Hydrologic Index Regression Equation Streamflow Volume
Example of a Seasonal Forecasting System Using a Physically-Based Hydrologic Model Temperature and Precipitation Forecast Estimated Hydrologic State VIC Hydrologic Model UW West-Wide Seasonal Hydrologic Forecast System Hydrologic Forecast http://www.hydro.washington.edu/forecast/westwide/
Schematic Diagram of a Hydrologic Forecasting System • Initial Hydrologic State • Soil Moisture • Snowpack • Hydrologic • Forecast: • Streamflow • Soil Moisture • Snowpack • Evaporation Hydrologic Model Future Temperature and Precipitation Forecast
Relative Roles of Future Precipitation and Initial Hydrologic State at Different Forecast Dates In October future precipitation dominates the inputs to the water balance. In April inputs to the water balance from future precipitation and storage are comparable. 99% 46% Simulated Long-Term Water Balance for the Pacific Northwest
Hydroclimate Signals in the Columbia River Basin Associated with ENSO and Pacific Decadal Variability Cool PDO Cool PDO Warm PDO Warm PDO Red = warm ENSO Green = neutral Blue = cool ENSO
Evaluation of Sept 1 ECMWF Nino3.4 Forecast for WY 2003-2005 WY 2003 WY 2004 WY 2005
In the PNW Climate forecasts based on ENSO predictions can provide useful information about future streamflows with lead times up to 12 months. Natural Streamflow Columbia River at The Dalles, OR Retrospective tests in the Columbia River basin have shown that during cool or warm events, ENSO-based streamflow forecasts are superior to assumptions of “normal” conditions about 65 % of the time on Oct 1 Red = Unconditional mean Blue = Ensemble mean Black = 2005 Observed Natural Streamflow (cfs)
Can we predict decadal precip. variability? -0.845 -0.264 -0.438 -0.053 (Regional to PDO Correlation R2 ) PNW Trend CRB Trend
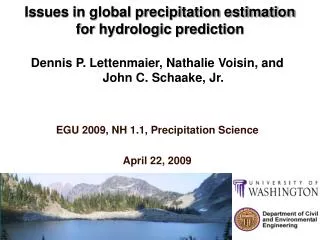
NOAA’s reforecast data set Model: T62L28 NCEP GFS, circa 1998 Initial Conditions: NCEP-NCAR Reanalysis II plus 7 +/- bred modes. Duration: 15 days runs every day at 00Z from 19781101 to now. (http://www.cdc.noaa.gov/people/jeffrey.s.whitaker/refcst/week2). Data: Selected fields (winds, hgt, temp on 5 press levels, precip, t2m, u10m, v10m, pwat, prmsl, rh700, heating). NCEP/NCAR reanalysis verifying fields included (Web form to download at http://www.cdc.noaa.gov/reforecast). Real-time probabilistic precipitation forecasts: http://www.cdc.noaa.gov/reforecast/narr Hamill, T. M., J. S. Whitaker, and X. Wei, 2004: Ensemble re-forecasting: improving medium-range forecast skill using retrospective forecasts. Mon. Wea. Rev., 132, 1434-1447. http://www.cdc.noaa.gov/people/tom.hamill/reforecast_mwr.pdf
Precipitation Skill Hamill, T. M., J. S. Whitaker, and X. Wei, 2004: Ensemble re-forecasting: improving medium-range forecast skill using retrospective forecasts. Mon. Wea. Rev., 132, 1434-1447. http://www.cdc.noaa.gov/people/tom.hamill/reforecast_mwr.pdf
Compositing Approaches Using the Pacific North America Pattern Gridded Temperature Precipitation Data 7-14 Day Temperature Precipitation Forecast Medium Range Forecast Model PNA Ensemble compositing
Ensemble PNA Forecast http://www.cpc.ncep.noaa.gov/products/precip/CWlink/pna/new.pna_index_ensm.html
Until mid-century, emissions scenarios play a minor role in the temperature impacts. Towards the end of the century they play a big role. Conclusions: 1) Adaptation will be an essential component of the response to warming over the next 50 years. 2) Mitigation of greenhouse gas emissions will play an important role in determining the scope of late 21st century impacts. +3.2°C °C +1.7°C +0.7°C 1.2-5.5°C 0.9-2.4°C Observed 20th century variability 0.4-1.0°C Pacific Northwest
Simulated Changes in Natural Runoff Timing in the Naches River Basin Associated with 2 C Warming • Increased winter flow • Earlier and reduced peak flows • Reduced summer flow volume • Reduced late summer low flow
Climate change assessments using scenarios show significant hydrologic changes due to temperature in basins with substantial snow accumulation in winter. 20th Century Change + 2.25 °C Naches River Basin on the East Slopes of the Cascades.
Observed Temperature Trends in the Western U.S. (1916-2003) Tmax Canada USA PNW CA GB Tmin CRB
Trends in April 1 SWE 1950-1997 Mote P.W.,Hamlet A.F., Clark M.P., Lettenmaier D.P., 2005, Declining mountain snowpack in western North America, BAMS, 86 (1): 39-49
Regionally Averaged Cool Season Precipitation Anomalies PRECIP
Climate Models vs. Statistical Approaches
Dynamic Approaches Based on Climate Models Potential Advantages: Ideally accounts for extraordinary changes in the climate system in ways that statistical procedures may ignore or discount (e.g. loss of sea ice in the arctic, altered radiative forcing due to current greenhouse forcing, effects due to soil moisture anomalies, etc.) Reforecast approaches suggest useful precipitation skill in some areas at 6-10 days, but linkage to hydrologic models is needed for test purposes. Limitations: Model bias must almost always be removed (so not a purely dynamic system) With some few exceptions, there has been very limited demonstrated precipitation skill in the U.S. at seasonal to interannual time scales in real-time forecast applications. (Role of downscaling procedures?) Relatively expensive to implement.
Statistical Approaches Potential Advantages: Exploits strengths of models (e.g. large scale index forecasts) while avoiding problems (precipitation simulation). Relatively low implementation costs. Relatively high skill. Limitations: Cannot account easily for unique features of individual years (e.g. different “flavors” of ENSO ) Requires a training data set—problems with parameter stationarity.
Conclusions Useful hydrologic forecasts based on weather or climate forecasts are available with lead times ranging from a few hours (flood forecasts) to 50 years or more (climate change scenarios). Many operational hydrologic forecasting systems are currently based on statistical models, however dynamic, physically-based tools are increasingly being used in both academic and operational forecasting systems. Dynamic forecasting systems based on weather or climate models directly linked to physically-based hydrologic models have important advantages in a rapidly evolving climate system. Short-term forecasts based on weather models have already reached a useful state of development, but many challenges remain at seasonal or longer time scales.
Example of a Short Time Scale Flood Forecasting System DHSVM distributed hydrologic model MM5 mesoscale atmospheric model Estimated Hydrologic State Streamflow Forecast River Stage Forecast
soil moisture snowpack streamflow, soil moisture, snow water equivalent, runoff local scale (1/8 degree) weather inputs INITIAL STATE Hydrologic model spin up Hydrologic forecast simulation NCDC met. station obs. up to 2-4 months from current LDAS/other real-time met. forcings for spin-up gap ensemble forecasts ESP traces (40) CPC-based outlook (13) NCEP GSM ensemble (20) NSIPP-1 ensemble (9) SNOTEL Update SNOTELUpdate 25th Day, Month 0 1-2 years back Month 6 - 12 Background:Forecast System Schematic