Download
1 / 1
10 likes | 186 Vues
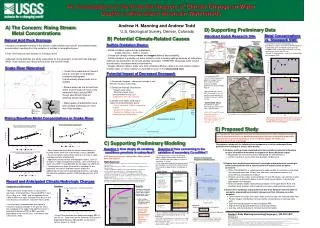
16. 14. 12. 10. 8. April 15th Snowpack SWE (in). 6. 4. 2. 0. 2002. 2003. 2004. 2005. 2006. 2007. 2008. 2009. 2010. Year. 200. Well WP1. 180. 160. Well WP2. Upper Snake River watershed. 140. 120. 100. Zinc Concentration (ug/L). 80. 60. 40. 20. 0. 2002. 2003.

E N D
16 14 12 10 8 April 15th Snowpack SWE (in) 6 4 2 0 2002 2003 2004 2005 2006 2007 2008 2009 2010 Year 200 Well WP1 180 160 Well WP2 Upper Snake River watershed 140 120 100 Zinc Concentration (ug/L) 80 60 40 20 0 2002 2003 2004 2005 2006 2007 2008 2009 2010 Year 250 Well WP1 (x1e-2) USGS Handcart Gulch Research Site 200 Well WP2 150 MAP AREA Cu Concentration (ug/L) 100 Denver 50 C O L O R A D O pH < 4.5 0 Continental 4.5 < pH <6.5 2002 2003 2004 2005 2006 2007 2008 2009 2010 Divide pH > 6.5 Year 108 ° 104 ° Average September Dissolved Zn at SW-117: Average September Dissolved Zn at SW-082: Snake River above North Fork Snake River Snake River below North Fork Snake River 1400 1000 y = 43.463x - 86303 900 1200 y = 31.408x - 62406 2 R = 0.7806 2 800 R = 0.7277 1000 700 Average Zn (ppb) 600 800 Average Zn (ppb) 500 400 600 300 400 200 100 200 0 1994 1996 1998 2000 2002 2004 2006 2008 2010 0 1994 1996 1998 2000 2002 2004 2006 2008 2010 Year Year A-Basin CDPHE CU EPA Linear (All) A-Basin CDPHE CU EPA Linear (All) Average September Flow: Snake River at Montezuma 100 Average September Dissolved Sulfate and Zn at SW-044: (Snake River Above Deer Creek) 90 1980’s Mean = 44.8 1800 160 80 y = -0.4375x + 912.62 y = 2.8335x - 5556.3 2 140 2 R = 0.0791 1990’s Mean = 40.4 R = 0.8209 1500 70 120 2000’s Mean = 35.0 60 1200 Average monthly flow (cfs) 100 Average Zn (ppb) Average Sulfate (ppm) 50 900 80 y = 29.342x - 57811 40 2 R = 0.831 60 600 30 40 300 20 20 10 0 0 1975 1980 1985 1990 1995 2000 2005 2010 2015 0 Year 1975 1980 1985 1990 1995 2000 2005 2010 2015 Year Zn Sulfate Linear (Sulfate) Linear (Zn) UZ Oxygen Concentration (% saturation) 0% 20% 40% 60% 80% 100% 0 50 Observed water table DO in Handcart Gulch well WP2 Cu content in drill core from WP1 100 Modeled unsaturated zone DO for Handcart Gulch well WP1 150 Mean of ~20 ppm 200 Depth (ft) Cu Enriched zone Stable Climate Warmer/Drier Climate 250 Atmosphere Atmosphere 300 WP1 Mean WT Elevation = 11,720 ft Observed water table DO in Handcart Gulch well WP1 Observed sulfate = 91 mg/L Modeled sulfate = 98 mg/L Ground Surface Ground Surface • Leached Zone: • Oxygen present • Primary Cu sulfides, mainly chalcopyrite (CuFeS2) oxidize to liberate dissolved copper • High dissolved Cu • Leached Zone: • Same conditions as before 350 Mean of ~70 ppm 400 Dissolved Cu conc. 10-20 mg/L in WP1 waters whereas samples from rest of site <1 mg/L Water Table • Abandoned Blanket Zone: • Oxygen now present • Secondary Cu oxides begin to oxidize • Blanket Zone: • Oxygen no longer present • Cu precipitates in secondary Cu oxides, mainly chalcocite (Cu2S) and covellite (CuS) Water Table • Blanket Zone: • same conditions, moves deeper • Protore Zone: • Low DO • Low dissolved Cu • Protore Zone: • Same conditions, moves deeper An Investigation of the Potential Impacts of Climate Change on Water Quality in Mineralized Mountain Watersheds Andrew H. Manning and Andrew Todd A) The Concern: Rising Stream Metal Concentrations D) Supporting Preliminary Data U.S. Geological Survey, Denver, Colorado Metal Concentrations vs. Snowpack SWE Handcart Gulch Research Site B) Potential Climate-Related Causes Natural Acid Rock Drainage • Dissolved Zn and Cu concentrations in groundwater samples from WP1 and WP2 collected in September were compared to prior April 15th snowpack SWE (snow water equivalent) at nearby Jackwhacker Gulch SNOTEL site • Zn and Cu concentrations show inverse correlation with snowpack SWE Sulfide Oxidation Basics • Numerous headwater streams in the western United States have low pH and elevated metal concentrations resulting from the oxidation of sulfides in mineralized areas. • Over 1500 miles of such streams in Colorado alone • Although mining activities are partly responsible for the generation of this acid rock drainage (ARD), much results from natural sources that are not man-made. • Sulfide oxidation requires three ingredients: • sulfide minerals + water + oxygen • Climate can directly influence water and oxygen delivery and availability • Sulfide oxidation is probably not water-limited in most mountain settings because all subsurface materials are expected to be at least partially saturated. HOWEVER, decreased water volume should lead to increased metal concentrations. • Oxygen diffusion rates in water very slow compared diffusion rates in air and sulfide oxidation reaction rates, so most oxidation is expected to occur in the unsaturated zone Snake River Watershed • Snake River watershed in Summit County, Colorado is mineralized, containing widespread hydrothermally altered rocks rich in sulfides • Stream water has low pH and toxic levels of Zn throughout much of the watershed due to natural ARD, though abandoned mines do influence stream locally • Water-quality characteristics have been studied extensively for more than three decades Potential Impact of Decreased Snowpack • Instrumented USGS research watershed located adjacent to upper Snake River watershed with extensive geologic, geochemical, and hydrologic dataset • Mineralized with natural ARD: Stream pH 3 to 4, Cu and Zn exceed aquatic life standards, but no historical mining • MONITORING WELLS located both in upper watershed and near stream 10 to 1100 feet deep • Wells WP1 and WP2 allow direct observation of unsaturated zone geochemical processes and water table conditions in recharge area 1) Decreased snowpack = decreased recharge in high elevation mountain watersheds Melting Snowpack Ground Surface • 2) Decreased recharge could lead to: • Deeper water tables • Potentially higher metal concentrations due to higher sulfide/water ratio (less dilution) Recharge Initial Water Table Oxygen Diffusion • 3) Deeper water tables could lead to higher metal concentrations due to: • Larger volume of sulfides exposed to oxygen • Longer UZ residence times • Secondary sulfides (more reactive) becoming exposed to oxygen Water Table Drop Unsaturated Zone: Oxygen Available Sulfides Newly Exposed To Oxygen New Water Table Site topographic map showing well and spring loctions Rising Baseflow Metal Concentrations in Snake River • Data consistent with hypothesis that decrease in snowpack will lead to increase is baseflow stream metal concentrations Saturated Zone: Anoxic Stream E) Proposed Study Groundwater Flow Our hypothesis that predicted long-term climate change in the Rocky Mountains might cause a long term increase in baseflow metal concentrations in mineralized mountain watersheds has serious implications for the health of aquatic life within and downstream of these watersheds C) Supporting Preliminary Modeling We propose a study with the following three components to better understand these potential future changes in stream water quality: Question 1: How deeply do oxidizing conditions penetrate in subsurface? Question 2: How concerning is the oxidation of secondary Cu sulfides? • Examine existing stream dissolved metal concentrations collected at baseflow in other mineralized watersheds throughout the Rocky Mountain region • Would allow an assessment of how widespread this phenomenon is • Collect new data in cases where only decades-old data exist • Mean September (baseflow) dissolved concentrations of multiple metals have risen substantially in past 3 decades • Zn concentrations increased by factor of 2 or more in upper and lower portions of watershed • Apparently not due to local anthropogenic factors, such as changes in water management practices; some uncertainty at lower sites (SW-117 and SW-082) but not upper site (SW-044) • Troubling because many trace metals, including Zn, are potentially toxic to fish and other aquatic organisms. Additionally, Zn can be transported long distances, extending the potential ecological impact of ARD well downstream of its input. • In mineralized areas containing elevated copper, copper often becomes enriched in a zone just below the water table in the form of secondary Cu sulfides • If the water table drops due to warmer and/or drier conditions resulting from climate change, this secondary copper blanket could begin to oxidize If UZ dominantly anoxic, falling water tables should have little impact! Evidence of Secondary Cu Enrichment at Handcart Gulch: • Model Approach: • Developed simple model of oxygen consumption and transport in UZ using Microsoft Excel • Oxygen consumed by pyrite oxidation. Used kinetic rates of Williamson and Rimstidt (1994). • Oxygen transported by diffusion from surface assuming Fick’s Law for a porous medium, and by advection in recharging groundwater (DO). • Steady-state oxygen concentration profile computed from boundary conditions by discretizing UZ into 30 cells and balancing oxygen inflow rate (transport in) and outflow rate (pyrite oxidation plus transport out) in each cell utilizing “Solver” tool. • Made generic model representative of conditions at Handcart Gulch site. Assumed reasonable input values based on literature and observations at wells WP1 and WP2 near Continental Divide above Upper Snake River. • 2) Employ more sophisticated numerical hydrologic and geochemical modeling to better understand the role of climatic factors in natural sulfide oxidation processes • Utilize TOUGHREACT, a uniquely powerful code capable of simulating unsaturated and saturated water flow, UZ gas flow, heat flow, and reactive chemistry in a fractured-rock (dual porosity) medium • Perform sensitivity studies using schematic 1D and 2D models; vary climate-related model inputs and quantify degree to which metal concentrations in discharging groundwater are impacted • Build site-specific models representing conditions in the upper Snake River and Handcart Gulch to better understand/constrain local sulfide oxidation processes Recent and Anticipated Climatic/Hydrologic Changes Results: Baseflow Temperature and Snowpack • 3) Collect more hydologic and geochemical data from Handcart Gulch to observe and better understand local climatic changes and their influence on sulfide oxidation • Collect higher resolution time-series water chemistry data from recharge zone wells • Perform oxygen monitoring in UZ and shallow saturated zone in recharge zone wells • Begin monitoring program for local snowpack SWE • Expand existing ground temperature monitoring network • Use new and existing data to constrain numerical models Assuming modeled and observed UZ conditions in upper Hancart Gulch representative of those in upper Snake River: • Mean annual air temperatures in north central mountains of Colorado have increased 0.9oC in past 30 yrs (Ray et al., 2008), and are expected to rise 1.0 to 1.5oC in the upper Colorado River basin in the next 30 years (Christensen and Lettenmaier, 2006). • Insuffient local snowpack data were found to evaluate snowpack changes in the past 30 years, but snowpack in the upper Colorado River basin is projected to decrease 10% to 30% (elevation-dependent) in the next 30 years (Christensen and Lettenmaier, 2006). 1. Sulfide oxidation expected to occur to considerable depths (roughly 200 ft) Results: • Stable-climate dissolved Cu concentration: 2. Sulfide oxidation in much if not most of upper Snake River watershed (where UZ <200 ft thick) might be enhanced by falling water tables 1. 4 mg/L • Dissolved Cu concentration after water table drop: • UZ Cu sulfide dissolution was simulated for pre- and post-water-table drop conditions using PHREEQC: • Reasonable model inputs based on literature values (Ague and Brimhall, 1989;Rimstidt et al., 1994; Fisher et al., 1992; Walsh and Rimstidt, 1986) • Assumed 100% oxygen saturation maintained and a UZ residence time of 10 days Contact: Andy Manning (amanning@usgs.gov), 303-236-1812 89.5 mg/L • Snake River baseflow has decreased roughly 22% in past 30 yrs. Total runoff for the Colorado River basin is projected to decrease 10% to 20% by the mid 21st century (Ray et al., 2008). References Ague, J.J., and Brimhall, G.H., 1989, Geochemical modeling of steady state fluid flow and chemical reaction during supergene enrichment of porphyry copper deposits, Economic Geology, 84:506-528. Christensen, N., and Lettenmaier, D.P., 2006, A multimodel ensemble approach to assessment of climate change impacts on the hydrology and water resources of the Colorado River basin, Hydrology and Earch System Sciences Discussion, 3:1-44. Fisher, W.W., Flores, F.A., and Henderson, J.A., 1992, Comparison of chalcocite dissolution in the oxygenated, aqueous sulfate and chloride systems, Mineral Engineering, 5: 817-834. Rimstidt, J.D., Chermak, J.A., and Gagen, P.M., 1994, Rates of reaction of galena, sphalerite, chalcopyrite, and arsenopyrite with Fe(III) in acidic solutions, in Ray, A.J., Barsugli, J.J., Averyt, K.B., Wolter, K., Hoerling, M., Doesken, N., Udall, B., and Webb, R.S., 2008, Climate Change in Colorado, Western Water Assessment, University of Colorado, Boulder, 52 p. Walsh, C.A., and Rimstidt, J.D., 1986, Rates of reaction of covellite and blaubleibender covellite with ferric iron at pH 2.0, Canadian Mineralogist, 24:35-44. Williamson, M.A., and Rimstidt, D., 1994, The kinetics and electrochemical rate-determining step of aqueous pyrite oxidation, Gechimical et Comsochimica Acta, 58:5443-5454. • Rapid flow of some of the water in the uppermost saturated zone to creeks and springs could result in higher Cu concentrations entering surface waters