Download
1 / 22
220 likes | 245 Vues
Explore the comprehensive evaluation of AURAMS including model configuration, results, and future work with emphasis on impacts through geospatial and population density analysis.

E N D
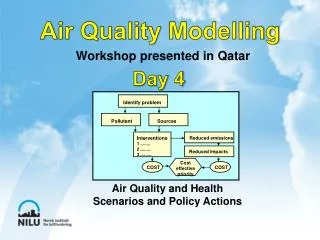
2006 Annual Operational Evaluation of the Environment Canada Air Quality Modelling System - AURAMS Jack Chen, L.Boucher, S.Cousineau, D.Davignon, A.Duhamel, S.Gilbert, J.Racine, M.Sassi, M.Samaali Air Quality Modelling Applications Section, Environment Canada, Montreal, QC 10th CMAS Conference, Chapel Hill, NC 2010 October 11-13
Outline • Modelling platform for policy scenarios • Model configuration for 2006 annual simulation • Integrated model evaluation database • Preliminary annual model evaluation results • O3, PM2.5, NO2, Speciated PM2.5 • Evaluation by geospatial attribute • Future work
Air Quality Modelling Platform • Comprehensive modelling platform for emission scenario simulations • Quantify air quality impacts across different regions and cities in Canada with respect to policy and regulatory proposals (e.g. Biodiesel fuel) • Results to be used for health impact assessments, and ecosystem impact analysis (e.g. acid deposition critical load)
AQ Modelling Framework • Model verification • Emission scenario comparisons • Health impact analysis • Ecosystem impact analysis
AURAMS CTM / Emissions • AURAMS v1.4 • modified ADOM-II gas-phase and aqueous-phase chemical mechanism; ISORROPIA inorganic aerosol module • sectional representation of PM size distribution (12 bins from 0.01 to 41 µm diameter) • nine PM chemical components: SO4, NO3, NH4, EC, POM, SOM, CM, SS, H2O • Monthly varying O3 BCON with dynamic tropopause adjustment • Emissions (SMOKE v2.4) • Canada: 2006 NPRI • USA: 2005 NEI version 4 (EPA emissions clearinghouse) • Mexico: 1999 from (EPA emissions clearinghouse) • Biogenic with BEIS v3.09 integrated online
Domain and Simulation Setup GEM meteorology (rotated lat/lon proj.): - variable resolution (575 x 641) - uniform core (432 x 565) at ~15km - 58 vertical layers AURAMS CTM (polar stereo. proj.):- outer domain 45-km at 60oN - Inner domains: 22.5-km - 28 vertical layers AURAMS run in 3 segments(1) 2005-12-10 to 2006-06-01(2) 2006-05-01 to 2006-10-01(3) 2006-06-01 to 2006-12-31
Model Evaluation Database System • Goal: a systematic, comprehensive model evaluation tool that allows traceability, reproducibility and automation • Central storage of measured and modelled data in a relational database • Open source software: • PostgreSQL + PostGIS spatial extension • Visualization: Quantum GIS, Google Earth, or direct connection to DB • Dynamic data queries base on chemical species, time, location, obs. measurement methods, and any geospatial attributes
Measurement Data In DB • O3 – Hourly measurements from EC NAPS (194 stations) and EPA AQS (1147 stations) • NO2 – Hourly measurements from EC NAPS (136 stations) and from EPA AQS (399 stations) • PM2.5 – Hourly measurements from EC NAPS (173 stations) and from EPA AQS (520 stations) • Also hourly SO2, CO, NO, PM10 • No 24-hr speciated PM2.5 yet
O3 Mean Bias (ppbv) NO2 Mean Bias (ppbv) PM2.5 Mean Bias (μg/m3) Spatial Comparison – 45km domain
Annual Evaluation – Hourly O3(45km domain) • Similar NME in US abd Canada • Correlation: 0.5 – 0.7 • Best NME in Spring, worse NME in Fall avg. obs: 25 ppb avg. obs: 35 ppb
Annual Evaluation – Hourly NO2 (45km domain) • Conc. variability decrease with increase temperature • Correlation: 0.5 – 0.6 • Best NME in Winter, worse NME in Summer avg. obs: 8 ppb avg. obs: 10 ppb
Annual Evaluation – Hourly PM2.5 (45km domain) • Conc. variability increase with increase temperature • Poorer correlation: 0.1 – 0.4 • Best NME in Summer, worse NME in Fall (Canada), Winter (US) avg. obs: 6 μg/m3 avg. obs: 8 μg/m3
Preliminary Speciated PM2.5(22.5km domains) • Daily averaged measurements from EC NAPS • Sample once every two days • 32-36 stations for PNO3, PSO4, PNH4 • 12 stations for PEC and POC • “No speciated PM2.5 from IMPROVE and EPA AQS”
Speciated PM2.5 – Nitrate (22.5km domains) • High conc. variability in winter, model under-predicts but good correlation • Very poor performance as temperature increases ** There are known biases in NAPS PNO3 from sample loss
Speciated PM2.5 – Total OC2.5 (22.5km domains) • Under prediction in all season, poor correlation • 2 product SOA module, with constant yield • No semi volatile organic • Under represent biogenic SOA
Geospatial Evaluation by Population Density (22.5km domains)
Current / Future work • Continue with verification DB development • speciated PM2.5 from NAPS, IMPROVE, EPA AQS • additional measurements: wet/dry deposition (NADP, CAPMoN, CASTNet etc.) • Explore other geospatial criteria to examine measurement data and model performance (i.e. by distance from road network, LULC, etc.) • Emission scenario modelling with the model platform • Impacts of biodiesel fuels on air quality • Canadian AQ impacts from US Transport Rule