Download
1 / 26
270 likes | 553 Vues
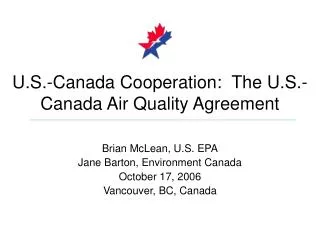
U.S.-Canada Cooperation: The U.S.-Canada Air Quality Agreement. Brian McLean, U.S. EPA Jane Barton, Environment Canada October 17, 2006 Vancouver, BC, Canada. The Impetus to Cooperate. In the 1980s, Canada and the US faced a common problem impacting eastern ecosystems — acid rain

E N D
U.S.-Canada Cooperation: The U.S.-Canada Air Quality Agreement Brian McLean, U.S. EPA Jane Barton, Environment Canada October 17, 2006 Vancouver, BC, Canada
The Impetus to Cooperate • In the 1980s, Canada and the US faced a common problem impacting eastern ecosystems — acid rain • Signed in 1991, the US-Canada Air Quality Agreement was designed to be flexible framework to address not only acid rain but other transboundary air pollution problems • U.S. and Canada committed to: • Specific emission limitations or reductions and timetables/programs • Notification and consultation mechanism • Compliance monitoring • Prevention of air quality deterioration and visibility protection • Coordinate/cooperate on scientific and technical activities, economic research • Review, assess, and regularly report on progress
Air Quality Agreement Structure • Agreement established Air Quality Committee to implement commitments, measure/report progress, identify evolving areas in transboundary air pollution • Co-chaired by U.S. State Department and Environment Canada • Membership includes relevant federal agencies and States/Provinces • Subcommittee on Program Monitoring and Reporting • Subcommittee on Scientific and Technical Cooperation • Obligations recognize different approaches taken by U.S. and Canada in their efforts to reduce air pollution • Success rests on supportive/cooperative working relationships and experience of trust
Acid Rain Annex — 1991 Established specific emission reduction commitments (caps for SO2), and detailed timetable for meeting commitments U.S. emission reduction commitments: • National SO2 reductions of 10 million tons, including caps of 8.95 million tons for power generation and 5.6 million tons for industrial sources • NOx reduction of 2 million tons from power generation and vehicles Canada emission reduction commitments: • Cap SO2 emissions in seven eastern provinces at 2.3 million tonnes by 1994, and cap national SO2 emissions at 3.2 million tonnes by 2000 • By 1995, reduce stationary source NOx emissions 100,000 tonnes below the forecast level and develop further annual national emission reduction requirements to be achieved by 2000 and/or 2005 • Implement NOX control program for mobile sources
Ozone Annex — 2000 • Scope of AQA extended in 2000 to address ozone transport between the U.S. and Canada and health effects • Established Pollutant Emission Management Area (PEMA) in transboundary region (18 states and the District of Columbia; central and southern Ontario and southern Quebec) • U.S. commitment: Cap on summertime utility and industrial boiler NOx emissions (NOX SIP Call); mobile source controls; implement new source standards for NOx and VOC reductions • Estimated U.S. transboundary region NOx reductions of 36% annual and 43% ozone season by 2010 • Canada commitment: NOx and VOC emission reduction measures including annual NO2 power plant cap by 2007 in transboundary region; Tier 2 engines and fuel regulations; solvents, paints, and consumer products; measures to achieve Canada-wide Standards for ozone • Estimated Canada transboundary region reductions from 1990: NOx 39% annual by 2010 and VOC 35% annual by 2010
Results: Reduced SO2 and NOx Emissions in the U.S. Total U.S. SO2 and NOx Emissions* • Total U.S. SO2 emissions have decreased 11.3 million tons (44%) from 1980 levels as of 2005. • Total U.S. NOx emissions have decreased 8.4 million tons (31%) from 1980 levels as of 2005. * Power industry emissions are measured by CEMS; emissions for other sources were estimated by interpolating from the 2002 final NEI data.
Results: Reduced SO2 and NOx Emissions in Canada Total Canadian SO2 and NOx Emissions • Total Canadian SO2 emissions in 2005 have decreased by 1.5 million tons (37%) since 1985. • Total Canadian NOx emissions in 2005 have decreased by 0.1 million tons (3%) since 1985.
Results: Environmental Benefits of Reduced Acidic Deposition SO4 Concentrations 1990-19942002-2004 • These reductions have had tremendous environmental and health benefits – the Acid Rain Program will result in $122 billion annually in U.S. benefits in 2010, including $6 billion in benefits to Canada • Future reductions under these programs, the Clean Air Interstate Rule, and new auto and diesel requirements are key components in the attainment of ozone and PM standards in the U.S.
Scientific and Technical Activities • Key Accomplishments: • Acid Rain and ecological monitoring and assessment • Development of extensive shared emission inventories • Ozone assessment report (1999) • PM science assessment report (2004) • Coordinated tracking of ozone air quality/deposition along the border • Informal consultations/collaborations on specific industrial facilities • Other collaborative efforts: Border Air Quality Strategy (2005) • The Great Lakes Basin Airshed Management Framework • Georgia Basin/Puget Sound International Airshed Strategy • Emissions Cap and Trading Feasibility Study for SO2 and NOx
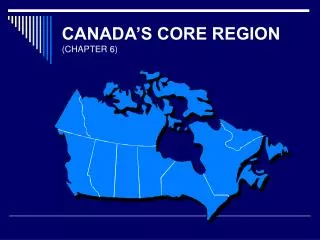
Great Lakes Basin Airshed Study Area: Southeast Michigan/Southwest Ontario Region
The Great Lakes Basin Airshed Management Framework • Objective: To improve air quality coordination and information exchange between the two countries - Administrative and structural frameworks - Control strategies and jurisdictional plans - Permitting systems for existing, new and modified sources - Compliance and enforcement systems - Policy uses for scientific tool and research • Conclusions: Coordinated management of the airshed is feasible and desirable • Barriers and obstacles can be overcome with sustained effort • Existing mechanisms and new opportunities are needed • Applicability to other areas within the Great Lakes Basin • Next step: Proposed guidelines for airshed management
Georgia Basin/Puget Sound International Airshed Project Results of the Project – so far… • Partner agencies have adopted the International Airshed Strategy for the Georgia Basin-Puget Sound • Health research focused on particulate matter is underway to better define regional issues of concern and priorities for remedial action • Transboundary collaboration on scientific research is continuing to better define air pollution causes and solutions • Ongoing regional collaborative measures to reduce emissions from motor vehicles, marine vessels, agricultural activities and woodstoves
Informal Consultations/Collaborations on Specific Facilities • Conner’s Creek Power Plant, Detroit, Michigan, U.S. • Successful discussion which ended when the power plant was required by EPA and Michigan to refuel with natural gas instead of coal • Algoma Steel Mill, Sault Ste. Marie, Ontario, Canada • Ongoing discussion with joint monitoring of air toxics and PM, information exchange on abatement at the plant, and reporting to the public • Boundary Dam Power Plant, Estevan, Saskatchewan, Canada • Successful conclusion this year with joint monitoring demonstrating that no air quality levels are being exceeded in the region
U.S. Experience with SO2 and NOx Cap and Trading Traditional Regulation: Command and Control • Reduced emissions significantly • Typically a technology or rate based method with limited monitoring • Very effective in many situations • Limited expertise about air quality management • Control or reduction options are limited or obvious • Control or reduction costs are reasonable • Established what needed to be done • Prescribed how and when each source was to do it
Experiments in Flexibility: Bubbles, Offsets, and Credits • Assumed command and control infrastructure • Provided some flexibility in how a source could comply, i.e., by getting reductions from another source • Required government approval to prevent: • “Paper Credits” • “Anyway Tons” • Unacceptable air quality impacts
Cap and Trade • An alternative to traditional regulation and credit trading • Not simply a trading feature added to existing regulation • Certainty that a specific emissions level is achieved and maintained • More regulatory certainty, compliance flexibility, and lower permitting and transaction costs for sources • Fewer administrative resources needed by industry and government (if kept simple) • Government focused on setting goals & assuring results, not on approving individual compliance actions • An incentive for innovation and early reductions • Can be compatible with other mechanisms • Lower costs make further improvements feasible
Why Cap and Trade Works • Full sector coverage – All sources (existing and new) included • Minimizes shifting of production and emissions (“leakage”) • Assures achievement of emission reduction goal without case-by-case review • Reduces administrative costs to government and industry • Cap on emissions – Government issuance of a fixed quantity of allowances • Limits emissions to achieve and maintain environmental goal • Limits creation of “paper credits” and “anyway tons” • Provides certainty to allowance market • Monitoring – Accurate measurement and reporting of all emissions • Assures accountability and results • Establishes integrity of allowances and confidence in the market • Trading – Unrestricted trading and banking (with source-specific limits allowed to protect local air quality • Allows companies to choose (and change) compliance options • Minimizes compliance cost • Ensures that trading will not cause “hotspots”
Type of transfer (auction, private) Seller name and account info Buyer name and account info Confirmation date, serial numbers and total allowances transferred Public Access to Allowance Data
17.3 Actual Emissions 15.7 SO2 emissions from power plants down by 5.5 million tons since 1990 Final Cap 11.9 11.2 10.2 89.0 Million Tons of SO2 Acid rain reduced by 25 – 40% Wet Sulfate Deposition 1990-1994 Wet Sulfate Deposition 2000-2004 Results: Major Reductions in SO2 Emissions and Acid Rain
2005 NBP states ozone season reductions • (May 1 – September 30) : • 72% from 1990 baseline • 57% from 2000 baseline • 11% from 2004 Summertime NOx Emissions Reductions Daily Emission Trends for NOx Budget Trading Program Units in 2003, 2004 and 2005 Total NBP Ozone Season NOx Emissions NOx Emissions (Thousand Tons)
National SO2 and NOx Power Plant Emissions SO2 NOx Projected, w/ CAIR Source: EPA
Feasibility Study • The U.S.-Canada AQA identified market-based mechanisms for information exchange, including emissions trading. In 2003, a joint study on SO2 and NOx emissions cap and trading was undertaken, and completed in 2005. • The key conclusions of the economic and air quality modeling were: • Acid rain, smog, and regional haze are problems in both countries that would be improved if SO2 and NOx emission caps were implemented in both countries at levels comparable to U.S. caps. • Cross-border trading would not alter the overall level of emission reductions nor the consequent benefits to air quality and the environment. – The costs to industry of complying with the caps would be cheaper with trading than without trading. • Significant technical advances and cooperation resulted from this study, such as development of analytical tools, shared emission inventories, integrated electricity and emission modeling and cross-border air quality modeling.
Feasibility Study • In Canada, enforceable SO2 and NOx emission caps for the electricity sector—and other sectors, if appropriate—and rigorous emissions monitoring and public reporting requirements, comparable in stringency to those in the U.S. • In both countries: • Legislative and/or regulatory changes to give the allowances in each country equivalency so that they could be traded freely and used for compliance in either country. • A commitment to pursue implementation of cross-border SO2 and NOX cap and trade. The study concluded that caps and cross-border trading would be feasible if certain critical elements were in place:
Over past 30 years, witnessed transition from identifying transboundary issues to developing binational solutions 2006 Biennial Progress Report and Third Five-Year Review of Program (15 year anniversary) With recognition of different governmental authorities, but commitment to common goals, expect continued progress working collaboratively U.S.-Canada Air Quality Agreement provides an example for international agreements, providing real progress in improving the environment Summary of Progress