Download

1 / 48
490 likes | 509 Vues
Learn how differentiation, cost leadership, and integration strategies impact business success. Explore value and cost drivers, competitive positioning, and case studies like Whole Foods Market. Understand sustainable competitive advantage and strategic position determination.

E N D
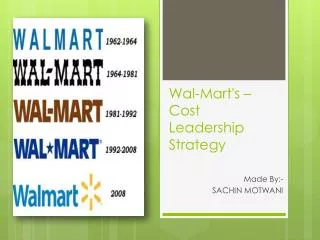
Business Strategy: Differentiation, Cost Leadership, and Integration
LO 6-1Define business-level strategy and describe how it determines a firm’s strategic position. LO 6-2 Examine the relationship between value drivers and differentiation strategy. LO 6-3 Examine the relationship between cost drivers and cost-leadership strategy. LO 6-4 Assess the benefits and risks of cost-leadership and differentiation business strategies vis-à-vis the five forces that shape competition. LO 6-5 Explain why it is difficult to succeed at an integration strategy. LO 6-6 Evaluate value and cost drivers that may allow a firm to pursue an integration strategy. LO 6-7 Describe and evaluate the dynamics of competitive positioning.
Chapter Case 6 Trimming Fat at Whole Foods Market • Whole Foods…Business Strategy Revitalization • Started as small natural-foods store 1980 • Became market leader; differentiation through organics and quality • Competitive advantage through 2008 • CEO John Mackey: Refocused Mission, Reduced Costs
Business Strategy and Competitive Advantage • A business-level strategy is an integrated and coordinated set of commitments and actions designed to provide value to customers and gain a competitive advantage by utilizing core competencies in specific individual product markets.
Business-Level Strategy: How to Compete for Advantage? • Answer the “Who, What, Why, and How” • Who - which customer segments to serve? • What needs, wishes, desires will we satisfy? • Why do we want to satisfy them? • How will we satisfy customers’ needs? • Details actions managers take in quest for competitive advantage • Single product or group of similar products
Industry and Firm Effects Jointly Determine Competitive Advantage EXHIBIT 6.1
Business Strategy and Competitive Advantage • Two fundamental questions: • How do you generate advantage? • How do you sustainadvantage? • Key idea for sustainability is “barriers to imitation.” • How long will it be before the first rival imitates the first mover? • How fast does new imitation occur once it starts? • These two factors determine appropriability.
Business Strategy and Competitive Advantage • Does market share generatecompetitive advantage? • The computer industry is an excellent example of the lack of correspondence between market share and profit rates. IBM was a clear market leader in terms of market share but had only mediocre economic performance relative to its rivals. High market share is no guarantee of high rates of profitability.
Business Strategy and Competitive Advantage • Does market share generate competitive advantage? • Perhaps high market share causes high profit rates. • But it could equally well be that there is a third factor (e.g., good service capabilities at Caterpillar), unobserved by us, that causes both high profitability and high market share. • In this case, we would see a correlation between profitability and market share but no causal explanation.
Business Strategy and Competitive Advantage • When can market share work to generate and sustain an advantage? • Scale economies combined with high exit costs may make market share a defensible advantage.
Sustainable Competitive Advantage • Costly Duplication due to: • Historical Conditions; • Uncertainty; • Social Complexity; and • Property Rights Protection.
Business Strategy and Competitive Advantage • An organization’s knowledge or expertise can lead to sustainable advantage if: • The knowledge is tacit rather than articulable; • Tacit Knowledge: “We know more than we can tell.” • Tacit Skills: Riding a bike, swimming, “learning by doing,” which is critical for maintaining a manufacturing base • The knowledge is not observable in use; • The knowledge is (socially) complex, rather than simple.
Strategic Position • Determined by Firm’s Business-Level Strategy • Two primary competitive levers: • Value (V) • Cost (C) • Economic Value Created: (V-C) • The greater (V-C) = Competitive Advantage • Strategic Position Based on: • Value creation • Cost
Cost Advantage CompetitiveAdvantage DifferentiationAdvantage Forms of Competitive Advantage Similar ProductAt Lower Cost Price PremiumFrom Unique Product
Strategic Position and Competitive Scope: Generic Business Strategies EXHIBIT 6.2
LO 6-1 Define business-level strategy and describe how it determines a firm’s strategic position. LO 6-2 Examine the relationship between value drivers and differentiation strategy. LO 6-3 Examine the relationship between cost drivers and cost-leadership strategy. LO 6-4 Assess the benefits and risks of cost-leadership and differentiation business strategies vis-à-vis the five forces that shape competition. LO 6-5 Explain why it is difficult to succeed at an integration strategy. LO 6-6 Evaluate value and cost drivers that may allow a firm to pursue an integration strategy. LO 6-7 Describe and evaluate the dynamics of competitive positioning.
Differentiation Advantage • Differentiation Advantage, a concept developed by economist Joan Robinson, occurs when a firm is able to obtain from its differentiation a price premium in the market which exceeds the cost of providing differentiation.
Value Drivers: Differentiation EXHIBIT 6.3 • Differentiation: • Product features, customer service, customization, and complements • Competitive advantage = economic value created (V-C) > competitors • Marriott line of Hotels
Toyota: From “Perfect Recall” to “Recall Nightmare” STRATEGY HIGHLIGHT 6.1 • Toyota’s strategic challenges…. • Launched Lexus 1989 • Luxury car segment dominated by Mercedes-Benz, BMW, Cadillac • LS400 line required recall a little over a year after launch • Turned threat into opportunity to establish reputation for superior customer service • Two years after launch Lexus ranked first on quality and customer satisfaction by J.D. Powers • 2010 Toyota has largest recall in automotive history • Needed to exhibit superior customer responsiveness again • 8 million vehicles recalled was much more challenging 1–24
Cost Drivers: Cost-Leadership EXHIBIT 6.4 • Cost Leadership: • Cost of input factors, economies of scale, and learning-curve and experience-curve effects • Competitive advantage = economic value created (V-C) > competitors • Walmart vs. Kmart • Dell vs. Compaq, Gateway, & HP
STRATEGY HIGHLIGHT 6.2 Ryanair: Lower Cost than the Low-Cost Leader! • The “Southwest Airlines of Europe” • “Lowest-cost airline in the world” • No window shades on older planes, seats don’t recline, etc. • Fares as low as $8 • Numerous fees and surcharges: pillows, blankets, check-in, etc. • 20+% of revenues flow from ancillary services 1–26
Economies of Scale and Diseconomies of Scale EXHIBIT 6.5
"Big Box" Retailers' Advantage • Cube-Square Rule: • Each dimension increases 50% (2 goes to 3) BUT • Each volume increases 237.5% (8 goes to 27) !!
Learning Curve: Sources of Gain • Need less time to instruct workers • Workers become more skillful in their movements • Develop better operation sequences • Machines and tooling are continually improved • Rejections and rework decrease • Management controls improved • Engineering changes become less frequent • Cost-effective improvements in product design • Enriched knowhow in managing and operating business • More efficient inventory handling and distribution methods
Limits of “Learning Curve” Advantages • Copying and reverse engineering of products; • Hiring a competitor’s employees; • Purchasing the know-how from consultants; • Obtaining the know-how from customers; • Experience advantages are often nullified by product obsolences and innovations.
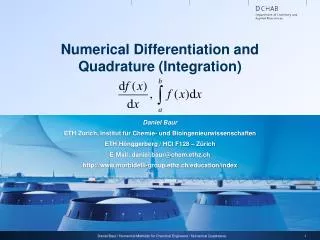
Learning Curve • The following discussion and applications focus on direct labor hours per unit, although we could as easily have used costs. In developing a learning curve, we make these assumptions: • Direct labor requirements will decrease at a declining rate as cumulative production increases. • The reduction in time will follow an exponential curve. In other words, the production time per unit is reduced by a fixed percentage each time production is doubled. We can use a logarithmic model to draw a learning curve. The direct labor required for the nth unit, kn, is • kn= k1 nb where • k1 = direct labor hours for the first unit • n = cumulative number of units produced • b = log r/log 2 • r = learning rate
Learning Curve • Example: The Bellweather Company has a contract for 60 portable electric generators. The labor-hour requirement for manufacturing the first unit is 100. With that as given, Bellweather planners develop an aggregate capacity plan using learning-curve calculations. They use a 90 percent learning curve, based on previous experience with generator contracts. • The labor requirement for the second generator is: • k2= k1 nb • = 100 (2)log 0.9/log 2 • = 100 (2)-.152 • = 100 (.9) = 90 hours • This result for the second unit, 90, is expected, since for a 90% learning curve there is a 10% percent learning between doubled quantities.
Learning Curve • Example: The Bellweather Company • For the 8th unit, • = 100 (8)-.152 = 100 (0.729) = 72.9 hours • This result is also obtained by 100 (.9) (.9) (.9) = 72.9 hours. • Learning curves can be used for: • Bid Preparation • Financial Planning • Production Scheduling
The Learning Curve Aircraft Assembly (1925-57): 80% Calculator (1975-78): 74%
Gaining Competitive Advantage Through Learning and Experience Curves EXHIBIT 6.6
LO 6-1 Define business-level strategy and describe how it determines a firm’s strategic position. LO 6-2 Examine the relationship between value drivers and differentiation strategy. LO 6-3 Examine the relationship between cost drivers and cost-leadership strategy. LO 6-4 Assess the benefits and risks of cost-leadership and differentiation business strategies vis-à-vis the five forces that shape competition. LO 6-5 Explain why it is difficult to succeed at an integration strategy. LO 6-6 Evaluate value and cost drivers that may allow a firm to pursue an integration strategy. LO 6-7 Describe and evaluate the dynamics of competitive positioning.
Competitive Positioning and the Five Forces EXHIBIT 6.7
LO 6-1 Define business-level strategy and describe how it determines a firm’s strategic position. LO 6-2 Examine the relationship between value drivers and differentiation strategy. LO 6-3Examine the relationship between cost drivers and cost-leadership strategy. LO 6-4 Assess the benefits and risks of cost-leadership and differentiation business strategies vis-à-vis the five forces that shape competition. LO 6-5 Explain why it is difficult to succeed at an integration strategy. LO 6-6 Evaluate value and cost drivers that may allow a firm to pursue an integration strategy. LO 6-7 Describe and evaluate the dynamics of competitive positioning.
Avon Pursuing an Integration Strategy EXHIBIT 6.8
Value and Cost Drivers EXHIBIT 6.9
Integration Strategy – Corporate Level • Conglomerates can coordinate above the SBU level • Tata Group from India • 2008 bought Jaguar & Land Rover • Prestigious differentiated products • 2009 Tata Motors creates a Nano car • Lowest-priced car in the world! • Zero to 60 mph in 30 seconds • No radio or glove box • Targets bicyclists to move to cars
LO 6-1 Define business-level strategy and describe how it determines a firm’s strategic position. LO 6-2 Examine the relationship between value drivers and differentiation strategy. LO 6-3 Examine the relationship between cost drivers and cost-leadership strategy. LO 6-4 Assess the benefits and risks of cost-leadership and differentiation business strategies vis-à-vis the five forces that shape competition. LO 6-5 Explain why it is difficult to succeed at an integration strategy. LO 6-6 Evaluate value and cost drivers that may allow a firm to pursue an integration strategy. LO 6-7 Describe and evaluate the dynamics of competitive positioning.
The Dynamics of Competitive Positioning • Strategic Positions need to change over time • eBay withdrew from selling new goods & sold Skype • Productivity Frontier • Value-cost relationship • Captures the best practices at a point in time • Mobile Devices • 2005 – Apple differentiator, Dell cost leader • 2010 – Apple still differentiator, HP moving to successful integrator, Dell shifting toward integrator
The Dynamics of Competitive Positioning: Apple, HP, and Dell EXHIBIT 6.10