Download
1 / 19
190 likes | 212 Vues
Understand the significance of organizing data visually through graphs, focusing on types, parts, and relationships represented in Earth Science contexts. Learn scaling and rate of change calculations for in-depth graph analysis.

E N D
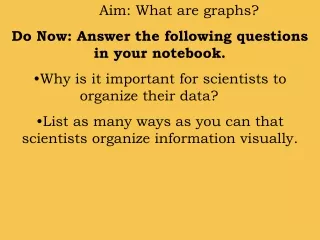
Aim: What are graphs? • Do Now: Answer the following questions in your notebook. • Why is it important for scientists to organize their data? • List as many ways as you can that scientists organize information visually.
I. Definitions: A graph is a way in which to visually show information. Graphs allow for easy comparison of multiple variables. Graphs are constructed from data table. A data table must include headings, units, and data.
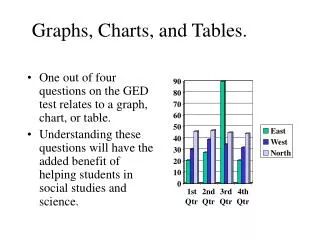
II. Types of Graphs • Line graph • Bar graph • Circle graph **We will only be making line graphs**
III. Graph Parts • Line graphs have two axis. • The horizontal axis is the X axis it usually is where the independent variable is graphed • The vertical axis is the Y axis it usually is where the dependent variable is graphed • EVERY graph needs a title.
III. Graph Parts continued: • The Independent Variable: is the variable that can be controlled by the experimenter (x-axis). • It usually includes: • time (dates, minutes, hours), • depth (feet, meters), • temperature (Celsius).
III. Graph Parts continued: • The Dependent Variable: is the variable that is directly affected by the independent variable (y-axis). • It is the result of what happens because of the independent variable. • Example: • How many inches something grew, • Number of oxygen bubbles produced, • How fast something happened
IV. Graphing Relationships Indirect / Inverse Direct Cyclic Direct relationship-as x gets bigger, y gets bigger. For example, the relation ship between age and size (until maturity) is a direct relationship. Indirect / Inverse-as x gets bigger, y gets smaller. For example, the relationship between time spent at the mall and the amount of money in your pocket is an inverse relationship. Cyclic- a repeating pattern.
Indirect / Inverse Direct Cyclic
Most relationships in Earth Science are cyclic. • the repeating high and low tides • temperatures go from cold to warm each day • temperatures go from cold to warm each year • the phases of the moon When done, obtain a Scaling a Graph I worksheet from the back top bin.
Scaling Overview AIM: How do you scale a graph?
When you graph, make sure you: • Have a proper title that describes the graph • Plan out your scaled axis before actually writing them • Label the x-axis and y-axis appropriately
One box along the x- axis is equal in length to one box along the y-axis.
Rate of Change • The rate of change measures the amount of change taking place in a given amount of time. • This equation is found on page 1 of the Earth Science Reference Tables: • Rate of Change = Change in Field Value Change in Time
Field value = what was being measured • Change in time = the amount of time it took for the change to occur Rate of Change = Change in Field Value Change in Time
Example Problem • Example: The temperature in a greenhouse is 10 degrees C at 12:00 a.m. At 3:00 a.m., the temperature is 5 degrees C. • At what rate did the temperature change? • There is a 5 degree C change in 3hrs. (5 degrees C / 3 hrs) Rate of change = 1.7 degrees C/hr.
Do now: - Take out your scaling a graph I and II. - I will be coming around to check scaling a graph II. - From your Scaling a graph I worksheet, find the rate of temperature change from January to July Rate of Change = Change in Field Value Change in Time
Rate of Change = Change in Field Value Change in Time
From your Scaling a graph II worksheet, find the rate of temperature change from July to December. Rate of Change = Change in Field Value Change in Time