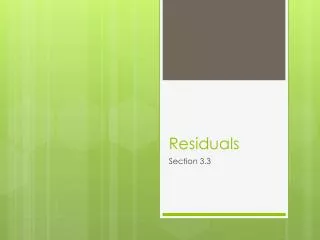
MSV 20: Residuals
120 likes | 303 Vues
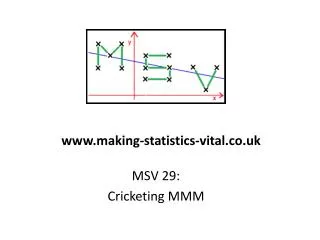
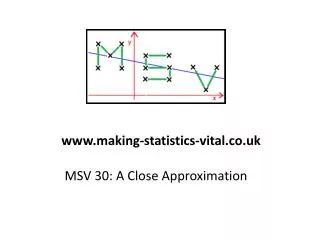
www.making-statistics-vital.co.uk. MSV 20: Residuals. Enter the following points into Autograph (or another graphing package) and draw the scatter diagram . (1, 4), (2, 7), (3, 6), (4, 8), (5, 9) Autograph File Hyperlink http://www.s253053503.websitehome.co.uk/ msv /msv-20/msv-20.agg.

MSV 20: Residuals
E N D
Presentation Transcript
www.making-statistics-vital.co.uk MSV 20: Residuals
Enter the following points into Autograph (or another graphing package) and draw the scatter diagram. (1, 4), (2, 7), (3, 6), (4, 8), (5, 9) Autograph File Hyperlink http://www.s253053503.websitehome.co.uk/ msv/msv-20/msv-20.agg
Now enter the equation y = mx + c. (Autograph gives both m and c the value 1, and draws y = x + 1.) Would the sum of the y-on-x residuals here be positive or negative? Vary cusing the Constant Controller. What happens to the sum of the y-on-x residuals?
Add the points on the line with x-coordinates 1, 2, 3, 4,and 5. Select the line, right-click, Enter point on curve... Now create vectors joining the points on the line to the scatter diagram points. Select each pair of points, right-click, Create vector... We can now see the residuals...
Consider the y-on-x residuals for the general line y = mx + c. Show that the sum of the y-on-xresidualshere will be 34 - 15m - 5c. Draw the horizontal line y = 34 - 15m - 5c on your scatter diagram. Pick some value for m and vary c: can you always find a value of c so that the sum of the y-on-x residuals is equal to 0? Now pick some value forcand vary m: can you always find a value for m so that the sum of the y-on-x residuals is equal to 0?
What do the lines that give the sum of the y-on-x residuals equal to zero have in common? Can you prove this? Answer: a line gives the sum of the residuals to be 0 if and only if it through the ‘centroid’ of the scatter diagram points. What is the equation of the line with gradient m go through the ‘centroid’ of your scatter diagram points? Edit your line to be this. (You will need to edit your horizontal line too.) Now how can we choose m sensibly to make our line the line of best fit?
Select the points and the line together (using Shift) and right-click. Then ‘y-on-x residuals’ and ‘Draw squares’. Watch the size of the squares change as we vary m. We will say the line of best fit is the one that minimises the sum of the area of these squares.
Answers The scatter diagram with y = mx + cadded looks like this: The sum of the y-on-x residuals is clearly positive here. i = (4 - 2) + (7 - 3) + (6 - 4) + (8 - 5) + (9 - 6) = 14. It is easy to adjust c to give a diagram where the sum of the y on x residuals is clearly negative.
So presumably there is a value forc where the sum of the y-on-x residuals is zero? Taking y = mx + c, the sum of the y-on-x residuals here is i = (4 - m - c)+(7 - 2m - c)+(6 - 3m - c)+ (8 - 4m - c)+(9 - 5m - c) = 34 - 15m - 5c. So if we add y = 34 - 15m - 5cto the diagram, it will show us the value of the sum of the y-on-x residuals for any particular m and c.
If the sum of the y-on-x residuals is zero, then the blue line and the x-axis will coincide. Playing with this situation shows that for any c, it is possible to find an m that gives the sum of the y-on-x residuals to be zero, and for any m, it is possible to find a c that gives the sum of the y-on-x residuals to be zero.
Is it true that any such line will go through the centroid of the data?
www.making-statistics-vital.co.uk is written by Jonny Griffiths hello@jonny-griffiths.net