Residuals
Residuals. Section 3.3. Recall from last week…. Regression lines are models for the overall pattern of a linear relationship between explanatory and response variables. Today we will look at…. Why are deviations also important?


Residuals
E N D
Presentation Transcript
Residuals Section 3.3
Recall from last week… • Regression lines are models for the overall pattern of a linear relationship between explanatory and response variables.
Today we will look at… • Why are deviations also important? • Because the LSRL is formed to minimize the distance vertical distance from the predictions to the observed values, they represent “left-over” variation. • These distances are called residuals.
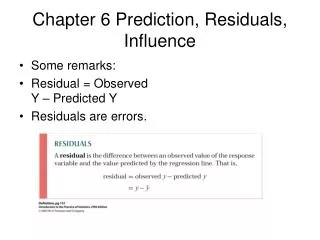
Residuals • The difference between an observed value of the response variable and the predicted value on the regression line. That is Residual = observed y – predicted y
Example 3.14, p. 167 • Plot scatterplot: 2nd, STAT PLOT • Plot LSRL: STAT, CALC, 8: LinReg(a + bx) L1, L2, Y1, Enter
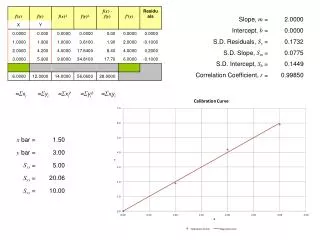
Example 3.14, p. 167 LSRL: For child 1, who spoke at 15 months, we predict the score:
Example 3.14, p. 167 The residual is Residual = observed y – predicted y = 95 – 92.97 = 2.03
Why is this useful? • Because residuals show us how far the data fall from our regression line, examining them helps us to determine how well the line describes the data.
Special Property of Residuals • The mean of the LS residuals are always zero!
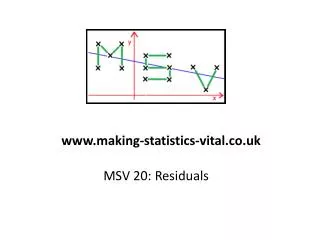
Residual Plot • Go to STAT PLOT • For Ylist, we will use RESID (found under 2nd STAT, 7: RESID) • Graph. ZoomStat (Zoom 9)
Residual Plot • A scatterplot of the regression residuals against the explanatory variable. • Helps us assess the fit of a regression line.
Influential Observations • An outlier is an observation that lies outside the overall pattern. • An observation is influential for a statistical calculation if removing it would markedly change the result of the calculation.
Example 3.15, p. 172 • The strong influence of Child 18 makes the original regression of Gesell score on age at first word misleading. The original data have r2 = 0.41, which means the age a child begins to talk explains 41% of the variation on a later test of mental ability. This relationship is strong enough to be interesting to parents. If we leave out Child 18, r2 drops to only 11%. The apparent strength of the association was largely due to a single influential observation.
Practice Problems • Exercises 3.46, 3.48