Download

1 / 10
120 likes | 242 Vues
This educational content focuses on the concept of residuals in data analysis, defined as the difference between observed data points and estimated values from a line of best fit. It explains how to create and interpret residual plots, emphasizing that random patterns in plots indicate a good approximation by the model, while U-shaped patterns suggest otherwise. Through a practical example involving plant growth measurements and calculations of residuals, learners gain insights into evaluating data fit, using the equation of a line, and estimating daily growth rates.

E N D
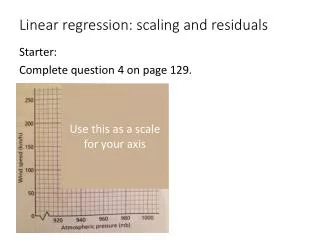
Analyzing Residuals ~adapted for Walch Education
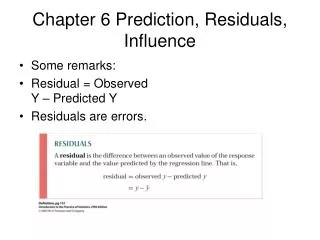
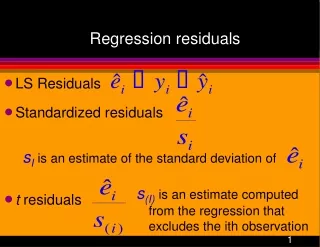
Concepts: • A residual is the distance between an observed data point and an estimated data value on a line of best fit. For the observed data point (x, y) and the estimated data value on a line of best fit (x, y0), the residual is y– y0.
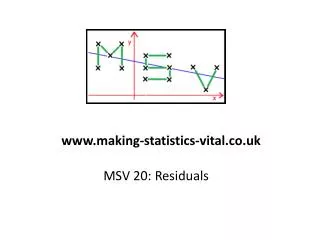
Concepts, continued… • A residual plot is a plot of each x-value and its corresponding residual. For the observed data point (x, y) and the estimated data value on a line of best fit (x, y0), the point on a residual plot is (x, y – y0). • A residual plot with a random pattern indicates that the line of best fit is a good approximation for the data. • A residual plot with a U-shape indicates that the line of best fit is not a good approximation for the data.
Let’s Practice… Pablo’s science class is growing plants. He recorded the height of his plant each day for 10 days. The plant’s height, in centimeters, over that time is listed in the table to the right.
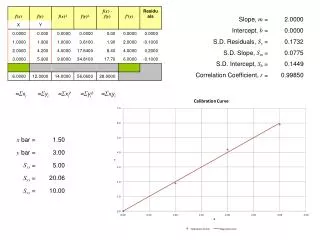
Pablo determines that the function y = 1.73x + 1.87 is a good fit for the data. How close is his estimate to the actual data? Approximately how much does the plant grow each day? Steps: • Evaluate the equation of the line at each value of x. • Calculate the residuals byfinding the difference between each observed value and each calculated value for each value of x • Plot the residuals on a residual plot
Plot the residuals on a residual plot • The plot of the residuals appears to be random, with some negative and some positive values. This indicates that the line is a good line of fit.
Now we can use the equation to estimate the centimeters grown each day… The change in the height per day is the centimeters grown each day. In the equation of the line, the slope is the change in height per day. The plant is growing approximately 1.73 centimeters each day.
Thanks For watching!!!! ~Ms. Dambreville