Understanding Prediction, Residuals, and Correlation in Statistical Analysis
220 likes | 352 Vues
This chapter explores the concepts of prediction, residuals, and correlation in quantitative data analysis. It defines residuals as the difference between observed and predicted values, illustrates their calculation through practical examples, and highlights issues like extrapolation. Additionally, it emphasizes the importance of the correlation coefficient (r) in assessing linear relationships between two variables and explains how to compute it. The chapter also covers the coefficient of determination (r²) and cautions against the influence of outliers, ensuring a comprehensive understanding of these key statistical metrics.

Understanding Prediction, Residuals, and Correlation in Statistical Analysis
E N D
Presentation Transcript
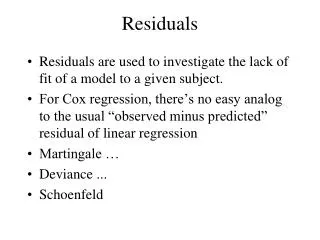
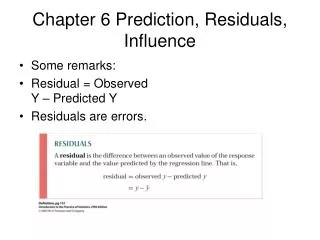
Chapter 6 Prediction, Residuals, Influence • Some remarks: • Residual = Observed Y – Predicted Y • Residuals are errors.
Chapter 6 Prediction, Residuals, Influence Example: • X: Age in months • Y: Height in inches • X: 18 19 20 21 22 23 24 • Y: 29.9 30.3 30.7 31 31.38 31.45 31.9
Chapter 6 Prediction, Residuals, Influence • Linear Model: Height = 25.2 +.271 * Age Examples • Age = 24 months, Observed Height = 31.9 • Predicted Height = 31.704 • Residual = 31.9 – 31.704 = .196
Chapter 6 Prediction, Residuals, Influence • Age = 30 years months • Predicted Height ~ 10 ft!! • Residual = BIG! • Be aware of Extrapolation!
Chapter 7 Correlation and Coefficient of Determination How strong is the linear relationship between two quantitative variables X and Y?
Chapter 7 Correlation and Coefficient of Determination • Answer: • Use scatterplots • Compute the correlation coefficient, r. • Compute the coefficient of determination, r^2.
Chapter 7 Correlation and Coefficient of Determination • Properties of Correlation coefficient • r is a number between -1 and 1 • r = 1 or r = -1 indicates a perfect correlation case where all data points lie on a straight line • r > 0 indicates positive association • r < 0 indicates negative association • r value does not change when units of measurement are changed (correlation has no units!) • Correlation treats X and Y symmetrically. The correlation of X with Y is the same as the correlation of Y with X
Chapter 7 Correlation and Coefficient of Determination • r is an indicator of the strength of linear relationship between X and Y • strong linearrelationship for r between .8 and 1 and -.8 and -1: • moderate linearrelationship for r between .5 and .8 and -.5 and -.8: • weak linearrelationship for r between .-.5 and .5 • It is possible to have an r value close to 0 and a strong non-linear relationship between X and Y. • r is sensitive to outliers.
Chapter 7 Correlation and Coefficient of Determination • How do we compute r? • r = Sxy/(Sqrt(Sxx)*Sqrt(Syy)) • Example: • X: 6 10 14 19 21 • Y: 5 3 7 8 12 • Compute: • Sxy = 72, Sxx = 154 and Syy = 46 • Hence r = 72/(Sqrt(154)*Sqrt(46)) = .855
Chapter 7 Correlation and Coefficient of Determination • r^2: Coefficient of Determination • r^2 is between 0 and 1. • The closer r^2 is to 1, the stronger the linear relationship between X and Y • r^2 does not change when units of measurement are changed • r^2 measures the strength of linear relatioship
Chapter 7 Correlation and Coefficient of Determination • Some Remarks • Quantitative variable condition: Do not apply correlation to categorical variables • Correlation can be misleading if the relationship is not linear • Outliers distort correlation dramatically. Report corrlelation with/without outliers.