
SlideServe
Menu
Préférences
© SlideServe · v2026

Probability Distributions

calder avatar
8 diapositives · 529 Views · Jul 03, 2012

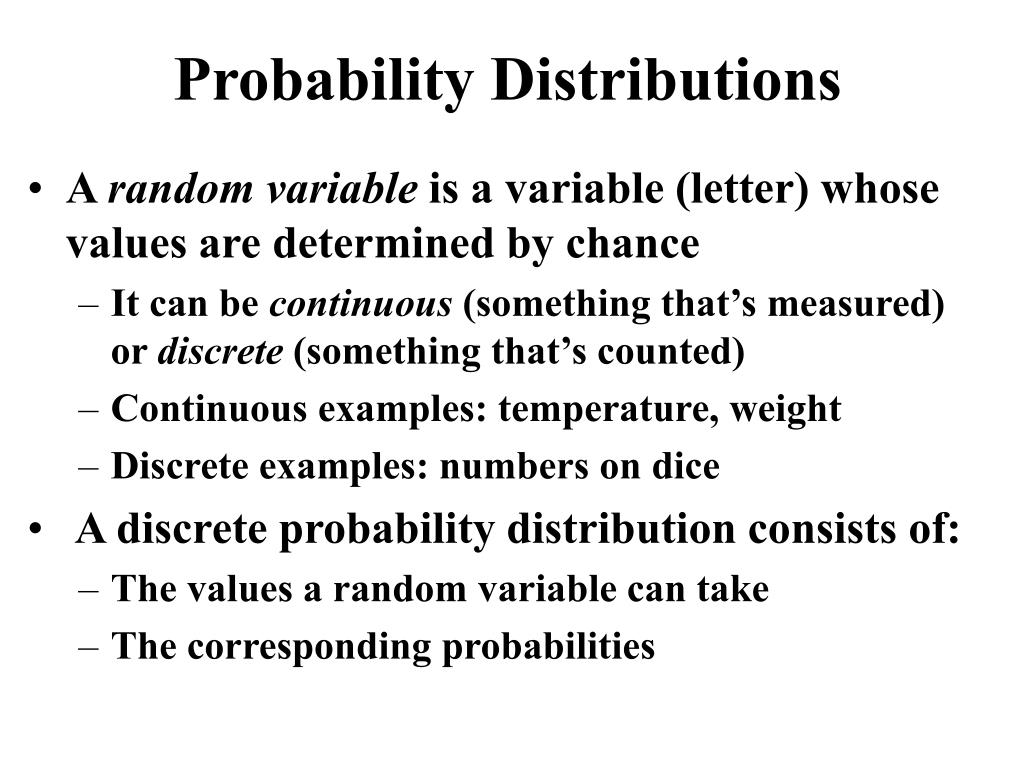
Probability Distributions. A random variable is a variable (letter) whose values are determined by chance It can be continuous (something that’s measured) or discrete (something that’s counted) Continuous examples: temperature, weight Discrete examples: numbers on dice
Probability Distributions - slide 1
01 / 8Probability Distributions
1 / 17

Télécharger la présentation

Probability Distributions
Une image / un lien ci-dessous est fourni (tel quel) pour télécharger la présentation

Politique de téléchargement : le contenu du site vous est fourni TEL QUEL pour votre information et votre usage personnel ; il ne peut être vendu, concédé sous licence ni partagé sur d’autres sites sans l’accord de son auteur.Le contenu vous est fourni TEL QUEL, pour votre information et votre usage personnel uniquement. Téléchargez la présentation en cliquant sur ce lien. Lors du téléchargement, si vous ne parvenez pas à télécharger une présentation, l’éditeur a peut-être supprimé le fichier de son serveur.Pendant le téléchargement, si vous ne parvenez pas à obtenir une présentation, le fichier a peut-être été supprimé par l’éditeur.

F I N

Plus de contenu associé

Transcription de la présentation
  1. Probability Distributions • A random variable is a variable (letter) whose values are determined by chance • It can be continuous (something that’s measured) or discrete (something that’s counted) • Continuous examples: temperature, weight • Discrete examples: numbers on dice • A discrete probability distribution consists of: • The values a random variable can take • The corresponding probabilities

  2. Probability Distribution Examples • Rolling one die and looking at the number • Outcomes are 1, 2, 3, 4, 5, 6 • Probabilities are 1/6, 1/6, 1/6, 1/6, 1/6, 1/6 • Tossing 3 coins and counting number of heads • Outcomes are 0, 1, 2, 3 • Probabilities are 1/8, 3/8, 3/8, 1/8 • Selecting one card from a deck, looking for a spade • Outcomes are “spade,” “not a spade” • Probabilities are 13/52 and 39/52

  3. Probability Distribution Requirements • The sum of the probabilities of all the events in the sample space must be 1: ∑P(X)=1 • The probability of each event in the sample space must be between 0 and 1, inclusive: 0 ≤ P(X) ≤ 1 for all X

  4. Statistics of a Probability Distribution • Mean: µ=∑X•P(X) • Expected value: Another word for the mean, written E(X) • Example: Find the expected value of the gain (amount of money you make) if you buy a lottery ticket

  5. Binomial Distribution • A binomial experiment is a special kind of probability experiment, with the following requirements: • A fixed number of trials • Each trial has two outcomes, designated success and failure • The outcomes of the trials are independent • The probability of success is the same for each trial • The outcomes and probabilities associated with a binomial experiment are called a binomial distribution

  6. Binomial Distribution • p = Probability of success in one trial • q = Probability of failure in one trial • Note that q = 1 - p • n = Number of trials • X = Number of successes in n trials • Note that 0 ≤ X ≤ n • In a binomial experiment, the probability of exactly X successes in n trials is:

  7. Binomial Distribution • You do not need to use the formula to calculate the binomial probabilities • You can read the probabilities from a table • Use Table B in Appendix C, starting on page 626 • Specify n, X, and p • Add or subtract table values to get “at most” or “at least” answers

  8. Statistics for the Binomial Distribution • Mean = µ • Standard deviation = 