Download
1 / 18
180 likes | 283 Vues
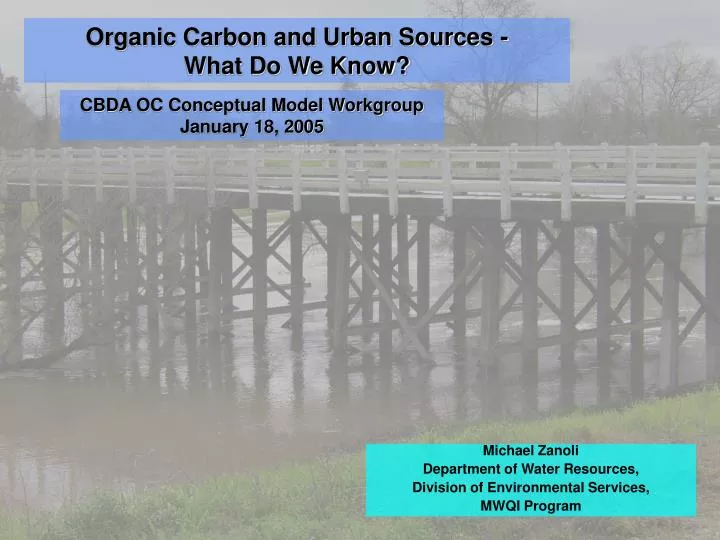
Organic Carbon and Urban Sources - What Do We Know?. CBDA OC Conceptual Model Workgroup January 18, 2005. Michael Zanoli Department of Water Resources, Division of Environmental Services, MWQI Program. What Do We Know About Urban OC Sources?.

E N D
Organic Carbon and Urban Sources - What Do We Know? CBDA OC Conceptual Model Workgroup January 18, 2005 Michael Zanoli Department of Water Resources, Division of Environmental Services, MWQI Program
What Do We Know About Urban OC Sources? • Increasing Delta-wide due to high growth rates • Difficult to monitor and evaluate impacts (NPS effect) • Potential impacts depend on hydrology, time, and proximity to intakes (as with other sources) • Basic metrics such as yields and reactivity appear comparable to current values for rivers, channels (Sac, SJR, Twitchell Is) ??
Daily NEMDC Contribution to Total Sacramento River TOC Load July 2001 - June 2004 Number of Days TOC Load Contributions to the Sacramento River were at or above 5%, 10%, and 20% Load Contribution _5% 10% 20% NEMDC 124 36 17 __________________________________________ n = 1080 n = 1080
Other OC Metrics Yields (gC/m2/yr) NEMDC = 3-6 Arcade Creek = 12 (USGS 2003) Temperate zones = 1-8 (Thurman) Reactivity (mmol THM/mol C) NEMDC = 6 -12 (median) Twitchell Is drains, channels = 2-16 (USGS) Rivers = 4-16.5 (USGS)
Lessons Learned from an Urban Drain (2001-04) • Natomas East Main Drainage Canal (NEMDC) discharge can contribute substantial TOC loads to Sacramento River during storm events, especially in late summer/initial fall storms • Data suggest cumulative discharges from urban sources in high-growth areas in the Delta and tributaries could be significant TOC loading sources for DW intakes during these storm events • With current and projected growth (>60%), potential impacts from urban runoff into the Delta will significantly increase within lifetime of CALFED program
What We Don’t Know About Urban OC Sources (Info Needed for Conceptual Model) 1. Data about physical and chemical processes affecting carbon release from different land uses in urban watersheds. 2. Knowing how changing land and water management practices affect TOC and DBP concentrations and loads? Source: adapted from Deverell pers. comm. 1/6/05 3. Data on other urban sources (Stockton, Tracy, etc.), esp tributary hydrology - e.g. SacR vs SJR. (timing & flow determines potential impact). 4. How much of urban OC gets to DW intakes and what fraction forms DBPs?
DOC Yields Sacramento River Basin • Yield < 5 Mg/km2 • 1 Sacramento River at Bend Bridge • 2 Sacramento River at Colusa • 9 American River at Sacramento • Yield 5-10 Mg/km2 • 6 Colusa Basin Drain • 8 Arcade Creek • 4 Feather River (including site 3, the Yuba River) • Yield 10 Mg/km2 • 5 Sacramento Slough • 10 Sacramento River Sites near Freeport Source: Saleh, et al,. 2003
Error Estimation!(The Elephant on the Table) • TOC/DOC Concentration - Drives yields (TOC, DOC), reactivity (DOC) - Real TOC/DOC value? Depends on: • Rep sampling/field Variability • Lab error (commonly +- 30% ) • Methods = comb vs wet ox • Flows - Stage measurements - Rating table - Sensor error • Load Estimates
Implications of Global Climate Change • More water earlier in season, increased intensity = more runoff in shorter period. • Salinity increase from sea level rise + levee instability = less Delta use possible? • SacR becomes more important in future, esp if PC built because Delta not used for conveyance (no peat issues). • Growth along I-5 and urban inputs to SacR could increase impacts.
Urban OC Load Nightmare • Imagine 20 yrs in future – a combination drought and storm pattern change has resulted in low river flows, low reservoir levels, and more water coming in a much shorter period. • Freak storms from above increase • The economy is slow – less logging and construction so usual nps oc loads in SacR are lower/stable. • But urban growth has continued, even if slowed a bit • Ag drainage lower/stable because less water + land conversion • RESULT ? • Urban source dominate river oc loads during many more storms!
Current Challenges • Hard to Get Data on Loading-no Baseline • No Regulatory Hook to Require Monitoring • Efforts to Work With the CVRWQCB Have Been Disappointing • Urban Discharge Growing
Assess Sources and Loads • Monitoring Station Needs • Location • Parameters • Regulatory Purposes • Cumulative Discharges- Basin Plan • EIR/EIS Impact Significance • Provide Priorities for Watershed Protection Projects
Assess Sources and Loads • Model Transport of Contaminants From Different Sources • Determine Priority Sources for Watershed Protection Efforts • Apply Information to Regulatory Processes or Control Efforts
Assess Sources and Loads • Loading Information From Various Land Uses • Determine Sampling Locations to Fill in the Gaps • Model Development for Transport and Load at Intakes.
Future Model Uses • Early Warning (Real Time forecasting) • Planning Tool for Future Impacts (long term forecasting) • Assess Sources and Loads • Monitoring and station location needs • Regulatory purposes ( TMDLs) • Provide priorities for watershed protection projects • Contamination Scenarios for Emergency Preparedness