Download
1 / 1
10 likes | 108 Vues
This study examines the impact of climate change on regional biodiversity by analyzing changes in tree and seedling diversity in different ecoregions of the United States. Results show significant shifts in evolutionary diversity over time, with implications for forest regeneration and adaptation. Findings suggest that tracking demographic indicators can reveal subtle biodiversity changes influenced by climate. Maximizing evolutionary diversity is crucial for future forest resilience.

E N D
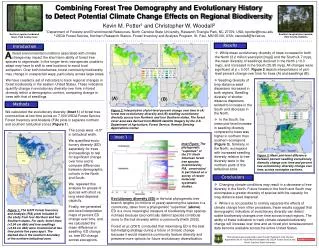
Combining Forest Tree Demography and Evolutionary History to Detect Potential Climate Change Effects on Regional Biodiversity Kevin M. Potter1and Christopher W. Woodall2 1 Department of Forestry and Environmental Resources, North Carolina State University, Research Triangle Park, NC 27709, USA; kpotter@ncsu.edu 2 USDA Forest Service, Northern Research Station, Forest Inventory and Analysis Program, St. Paul, MN 55108, USA; cwoodall@fs.fed.us Southern longleaf pine savanna, Hale County, Alabama Northern riparian hardwood forest, Polk County, Iowa Results Introduction • While mean evolutionary diversity of trees increased in both the North (3.2 million years/plot [myp]) and the South (4.7 myp), the mean diversity of seedlings declined in the North (-10.3 myp), and increased in the South (35.85 myp). All changes were significant at p < 0.001. Figure 2 depicts interpolations of plot-level percent change over time for trees (A) and seedlings (B). A ltered environmental conditions associated with climate change may impact the short-term ability of forest tree species to regenerate. In the longer term, tree species unable to adapt may have to shift to new locations to avoid local extirpation. Over both timeframes, forest community biodiversity may change in unexpected ways, particularly across large areas. We have created a set of indicators to track regional changes in forest biodiversity in the eastern United States. These indicators quantify change in evolutionary diversity over time in forest diversity within a demographic context, comparing change in trees with that of seedlings. • Seedling diversity of long-distance seed dispersers increased in both regions. Seedling diversity of shorter-distance dispersers tended to increase in the South and decrease in the North. • In the South, the mean plot-level increase in seedling diversity compared to trees was higher in northern than southern ecoregions (Figure 3). Similarly, in the North, ecoregions with increased seedling diversity relative to tree diversity were in the northern parts of this latitudinal zone. (A) (B) Methods Figure 2: Interpolation of plot-level percent change over time in (A) forest tree evolutionary diversity and (B) seedling evolutionary diversity across four Northern and four Southern states. The forest cover area was derived from MODIS satellite imagery by the U.S. Department of Agriculture, Forest Service, Remote Sensing Applications Center. We calculated the evolutionary diversity (Inset 1) of forest tree communities at two time points on 7,000 USDA Forest Service Forest Inventory and Analysis (FIA) plots in separate northern and southern latitudinal zones (Figure 1). The zones were ~6.5° in latitudinal width. We quantified evolu-tionary diversity (ED) separately for trees and seedlings to test for significant change over time and to compare differences between demographic cohorts in the North and South. We repeated this analysis for groups of species with short vs. long seed dispersal capacity. Finally, we generated plot-level interpolation maps of percent ED change over time, and we calculated the mean difference in seedling ED change vs. tree ED change across ecoregions. Inset 1 Inset Figure: The phylogenetic“supertree” of the 311 North American forest tree species inventoried by FIA, constructed in part based on a survey of recent molecular systematic studies. Figure 3: Mean plot-level difference between percent seedling evolutionary diversity change over time and percent tree evolutionary diversity change over time, across ecoregion sections. Conclusions • Changing climate conditions may result in a decrease of tree diversity in the North. Future forests in the North and South may encompass a greater diversity of species with the capacity for long-distance seed dispersal. • While it is not possible to entirely separate the effects of climate change from other processes, these results suggest that demographic indicators of evolutionary diversity can detect subtle biodiversity changes over time across broad regions. The ability of these indicators to track climate-related biodiversity change will increase over time and as forest plot remeasurement data become available across the entire United States. Evolutionary diversity (ED)is the total phylogenetic tree branch lengths (in millions of years) spanning the species in a community, taken from a phylogenetic “supertree” (above). ED is a more meaningful measure of biodiversity than species richness because taxonomically distinct species contribute more to the trait diversity within a community (Faith 2002). Forest et al. (2007) concluded that maximizing ED is the best bet-hedging strategy during a future of climatic change because it would maximize community feature diversity and preserve more options for future evolutionary diversification. Figure 1: The 6,970 Forest Inventory and Analysis (FIA) plots included in the study from four Northern and four Southern states. For each, forest trees (>2.54 cm dbh) and tree seedlings (<2.54 cm dbh) were inventoried at two time points five years apart. The dashed line is the southern boundary of the northern latitudinal zone. This research was supported in part through Research Joint Venture Agreement 09-JV-11330146-087 between the USDA Forest Service and North Carolina State University.