Download
1 / 57
570 likes | 670 Vues
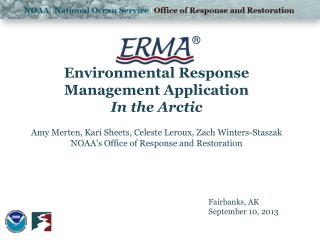
The hydrologic consequences of environmental change in the circumpolar arctic and other regions. Laura C. Bowling December 20, 2001 Department of Earth, Ecological & Environmental Sciences Seminar University of Toledo. Presentation Outline. Introduction Why study the Arctic?

E N D
The hydrologic consequences of environmental changein the circumpolar arctic and other regions Laura C. Bowling December 20, 2001 Department of Earth, Ecological & Environmental Sciences Seminar University of Toledo
Presentation Outline • Introduction • Why study the Arctic? • Preliminary circumpolar modeling • Small scale - field studies • Watershed scale • Remote sensing • Model parameterization • Continental scale • Methods of parameter transfer • Circumpolar applications • Future research directions
Projected future high latitude temperatures Scenario B2: approximate doubling of CO2 emissions Projections for year 2100 From U. Cubasch, Max-Planck-Institut für Meteorologie
100 Total Area Gauged Area Total Area (%) 0 Latitude 45 55 65 75 85 Arctic drainage basin Mackenzie Lena Ob Yenesei
VIC Model Applications • Grid cell resolutions from 1/8o – 2o • Applied to numerous large-scale river basins: • Arkansas-Red (Abdulla et al. 1996), • Weser, Germany (Lohmann et al. 1998), • Columbia (Nijssen et al. 1997), • Mississippi (Maurer et al. 2001)
Simulated monthly discharge - details in Bowling et al. (2000) in The Freshwater Budget of the Arctic Ocean, E.L. Lewis, ed. Mackenzie River Ob River
Snow extent results Observed (NSIDC weekly snow extent) Average annual days of snow cover (1979 – 1993) Simulated
Key hydrologic features of the Arctic • Permafrost and frozen ground • Lakes and wetlands • Snow (re)distribution
Permafrost and frozen ground • Limits meltwater infiltration into soil • Restricts soil moisture storage capacity • Limits surface/ groundwater interaction
Lakes and Wetlands Tavvavuoma, Torne River basin • Attenuation of seasonal runoff • Increase in latent heat over sensible heat
Snow (Re)Distribution • Sublimation of blowing snow • Increase in winter latent heat • Decrease in snow available for melt • Variable snow coverage • Variable melt water availability • Advection of sensible heat from bare areas
Summary of field activities On-going monitoring by UAF Additional data collection Air and soil temps Humidity Daily snow surveys River discharge Full met variables Station decommissioning Snow temperature profiles GPS surveys of saturated areas Monitoring of pond energy balance GPS surveys Active-layer depths Winter Spring Summer Autumn
Start of snow surveys discharge SWE Putuligayuk River discharge monitoring
Change in surface saturation June 2000 September 2000
Net Radiation Water Temperature Water Depth Observed Simulated Pond energy balanceJune – September, 2000
Synthetic Aperture Radar (SAR) ground truth data • 21 areas surveyed with GPS (not all shown) • Classified as: • open water • emergent veg. • wet tundra or • dry tundra Surveyed areas Prudhoe Bay Betty Pingo site Basin boundary Putuligayuk River 10 km
Active layer depth • Average active layer depth versus terrain type • Surveyed in the foothills of the Brooks Range
Putuligayuk River Location Prudhoe Bay
Use of SAR imagery for Arctic lakes classification • SAR is not limited by extensive cloud cover, low solar zenith angles and darkness. • Distinguishable features: • Specular scattering from calm water surfaces results in low backscatter signal (black). • Volume and surface scattering dominate in non-water areas (gray). • Double bounce scattering between the water surface and vegetation increases backscatter in wetlands (gray to white). • Buildings and other human-made objects tend to behave as corner reflectors (white).
RADARSAT Image Classification • Sequence of 8 RADARSAT ScanSAR images from June - September, 2000 • Color composite of first (wet) and last (dry) image used to select samples for supervised classification: • Wetland areas • Dry tundra • Permanent lakes Putuligayuk River
Surveyed areas Putuligayuk basin boundary 10 km SAR ground truth data September 15, 2000 Classification Results
Saturated area vs. time % change in saturated extent: 1999 - 76% (275 > 66 km2) 2000 - 72 % (205 > 58 km2) Classified SAR images
Estimate of evaporation from lakes Summer 2000 • Cumulative depth of lake evaporation: • 18 mm normalized by basin area • 60% of observed storage during snowmelt
Lakes and wetlands algorithm • Lake energy balance based on: • Hostetler and Bartlein (1990) • Hostetler (1991) • Assumptions: • One “effective” lake for each grid cell • Laterally-averaged temperatures • Depth-area relationship derived from RADARSAT
Putuligayuk River simulated discharge,May, 1999 – November, 1999 Simulated, without lakes Discharge (m3/s) Simulated, with lakes Observed
Lakes and wetlands algorithm testing Karesuvanto - 4% lake area = observed = simulated
Annual evaporation (mm)Torne River headwater catchments with lakes without lakes
Sub-grid variability in terrain exposure Slope F • Terrain weighting factor based on curvature and slope (Liston and Sturm 1998). • Wind speed ~ f (F)
1-Af SWE M Use of the terrain weighting factor • Quantify sub-grid variability in wind speed for calculation of grid cell average sublimation of blowing snow • Regionalize snow cover depletion curve to allow representation of fractional snow-covered area • Impose temperature distribution at each soil temperature node to allow spatial variation of infiltration capacity and active layer depth across the grid cell
Science questions • How well can runoff in gauged and ungauged arctic catchments be predicted, and how does prediction skill vary as a function of spatial scale? • How do changes in the areal extent of snow cover over the Arctic drainage basin affect the space-time distribution of runoff production and the discharge of north-flowing rivers? • To what extent are changes in water and energy fluxes in response to variations in climate forcings modulated by surface water impoundment in lakes and wetlands and seasonal snow cover?
Generalizing of test applications • Parameter transfer from regional catchments • Soil drainage parameters, etc. • Regional relationships • Lake depth-area relationships • Terrain distribution function
Circumpolar calibration catchments Calibration catchments: 1a, 2a, 3a, 4a, 5a and 6a Transfer test catchments: 1b, 2b, 3b, 4b, 5b and 6b
General topics of research • Northern processes • Lakes and wetlands • Climate variability and impacts
Northern processes • Snow sublimation • Influence of atmospheric stability • Compensating effect of sensible heat fluxes • Rehabilitation of tundra and boreal forest ecosystems in permafrost environments • Alaska road removal
Lakes and wetlands • Effect of lakes on regional climate • Spatial distribution of energy fluxes • Difference in large versus small lake systems • Compatibility of remote sensing and hydrologic models • Radiative skin temperature vs. bulk temperature • Snow structural changes • Land use effects on quality and quantity of runoff inputs to lacustrine environments • Temperature • Sediments and pesticides